Happy New Year!
I have 7 trading accounts in my portfolio. One of the accounts returned +52% in 2023. See you next year!
Lol. That seems to be the industry’s standard to talk about annual performance, right. Let’s look further what all of my assets combined did in 2023.
90% of trading is about sitting and waiting
I had 3712 trades in total in 2023. Before passive investors start to calculate my time rate and the alternative cost, let me say that 95% of the trades I did not execute manually. Rest assured that I don’t spend more time on running my mechanical semi-automated trading system than it takes investors to read balance sheets and figure out fundamentals of their investments.
I’m not going to calculate the summarized stats like win rate and win/loss ratio for all of my trades this time, because the strategies in my portfolio are so different and it wouldn’t make sense. But I will share some insights from 2023 that are more interesting to go over before reaching my overall result.
Options, volatility, premiums
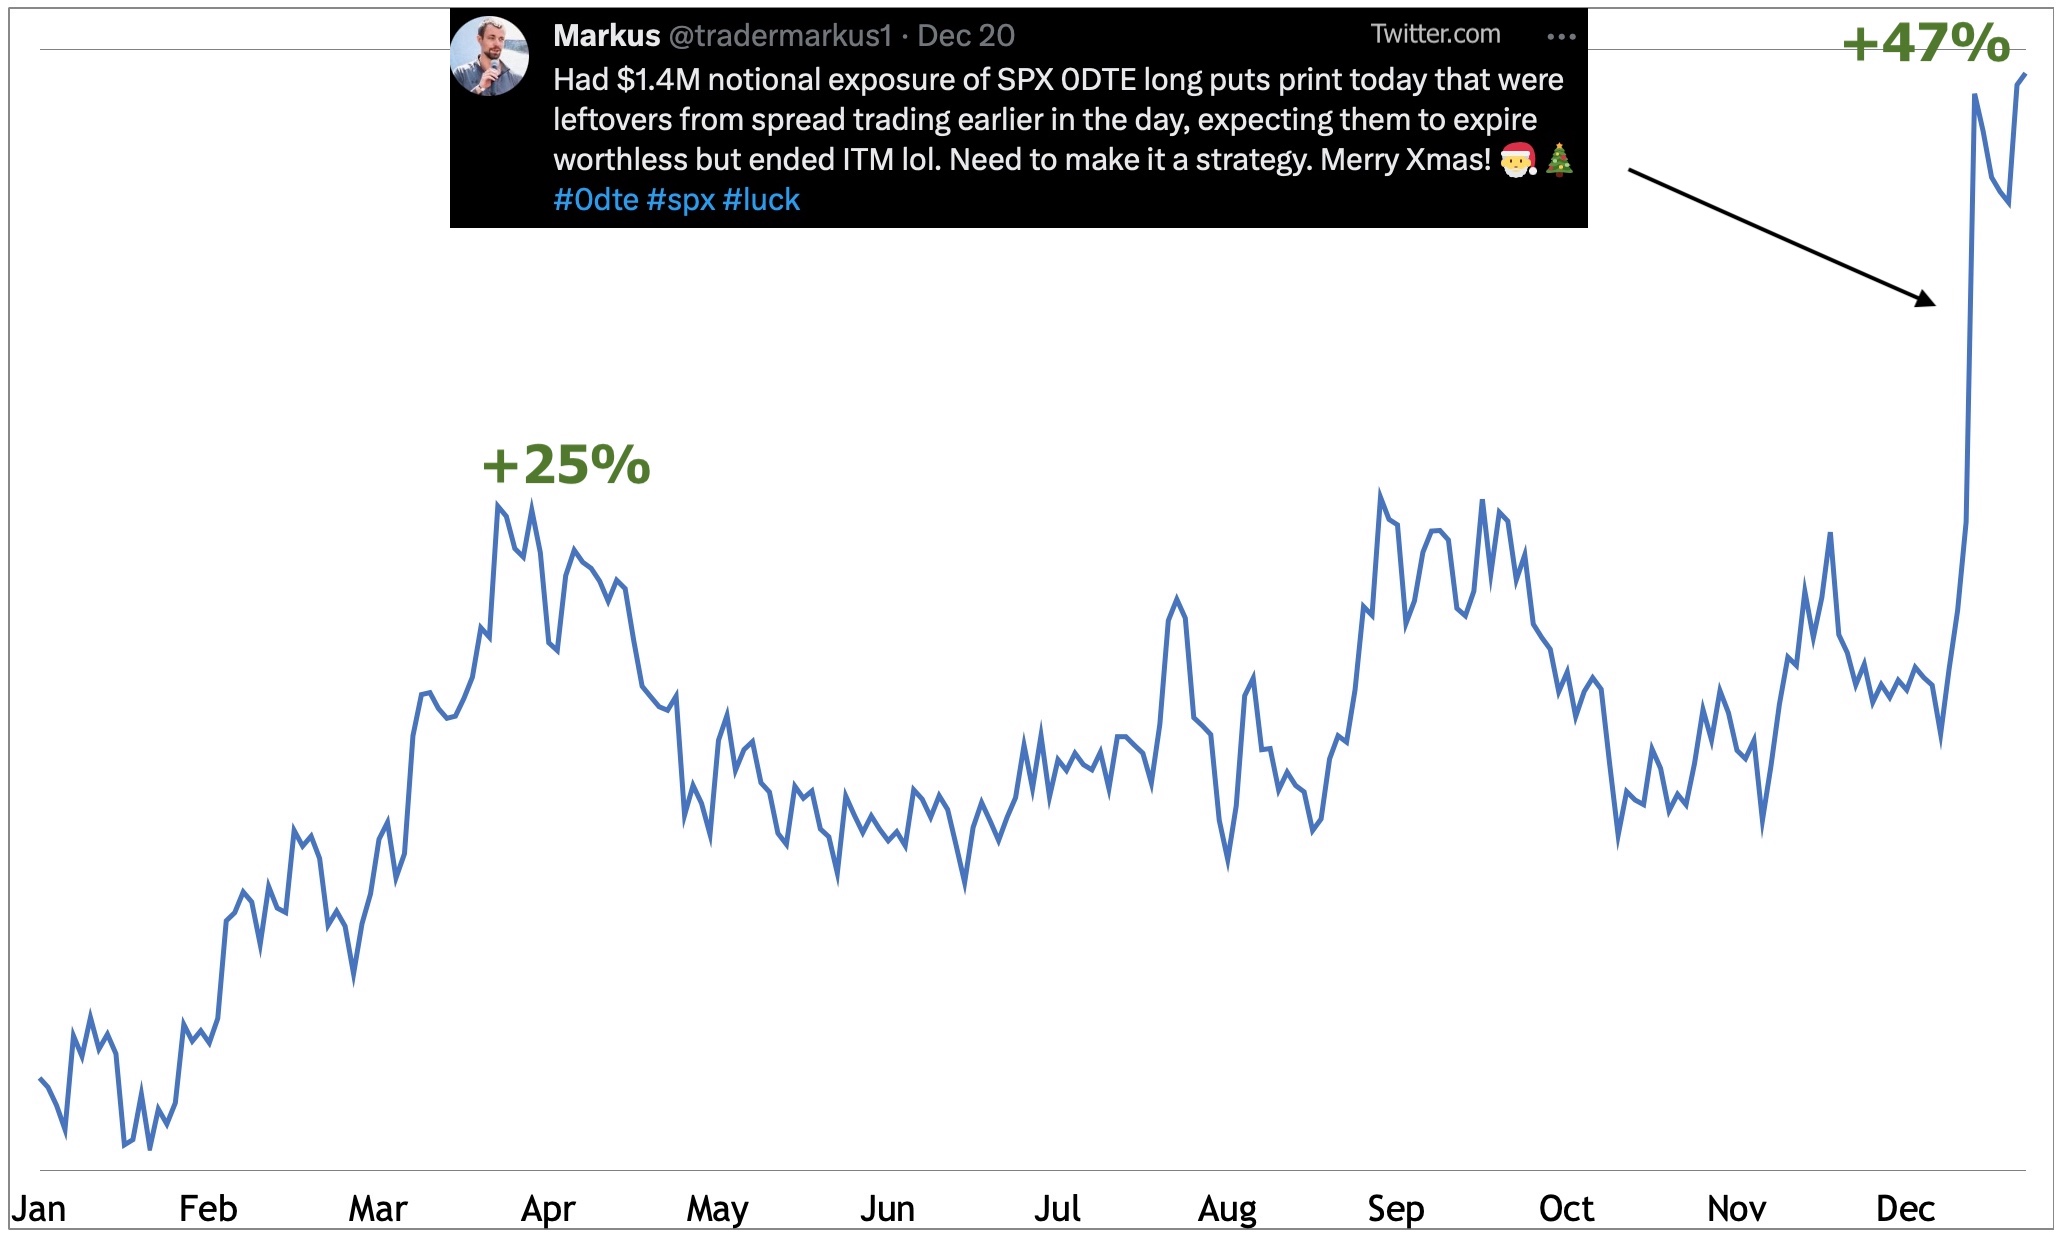
Out of the 3712 trades in total, there were 2261 options trades, mostly in SPX 0DTE. My options program returned +47% on the capital allocated to it, which was less than 1/10 of the overall portfolio. I trade spreads that allow me to significantly cut down on buying power requirements, so not to confuse capital allocated vs the notional value of these options contracts. To put it into context, one SPX options contract has notional value of $477k (4770 x 100) at the moment, but may require only $1-5k BP to trade it as a defined risk spread trade vs $96k (20%) required to trade it short naked.

The chart above shows the equity curve of my options program in 2023. It had a stellar run at the beginning of the year when premiums were good, but went into a drawdown in summer with volatility (VIX) coming down to levels not seen since 2019. I optimized the strategy a bit in November to avoid selling premium into liquidity holes during the day, which I knew about before but didn’t understand clearly before seeing the strategy work in live. So even the summertime would have been much better in theory according to the backtest if I had applied it earlier. Nevertheless, I had a lucky day in December that I posted about on X, when I got 2900% return (30x) on one day-trade. After looking at it more closely and having done some research, these kinds of outlier trades are actually embedded to my strategy and may happen once in a while if extreme market moves occur before the close. There’s often luck involved in trading but the idea behind it is still to position the strategy in such a way that it could be able to capture outlier moves, so it’s about putting oneself into a position to become lucky. Call it asymmetrical betting.
The BIG got bigger
Other strategies had the following volumes: 974 day-trades in stocks, 312 swings, 157 trend and momentum trades (around 40 trades are still open) and 8 hedges (a couple are open).
The main theme of 2023 in US market seems to have been the big tech, also referred to as the “Magnificent Seven”. For the most part of last year I held these names in my portfolio, which were the largest contributors to my absolute return in dollars. My best performing positions in stocks were NVDA (+150%), META (+90%) and XPO (+50%). Obviously I had lots of small losers too, but I limit any single loss to be less than 1% of the portfolio. It creates asymmetry in the trade distribution, where winners can pay for all the losers and still make money.
Next 1000 trades
A year-old excerpt from the summary of 2022:
“I’m satisfied with all the research and development I did in 2022. Drawdowns are inevitable, but I know that if I keep pushing the buttons and let my trading system play out, then the portfolio will come back strong, because it’s based on math and probabilities, not hope and desires. To next 1000 trades!”
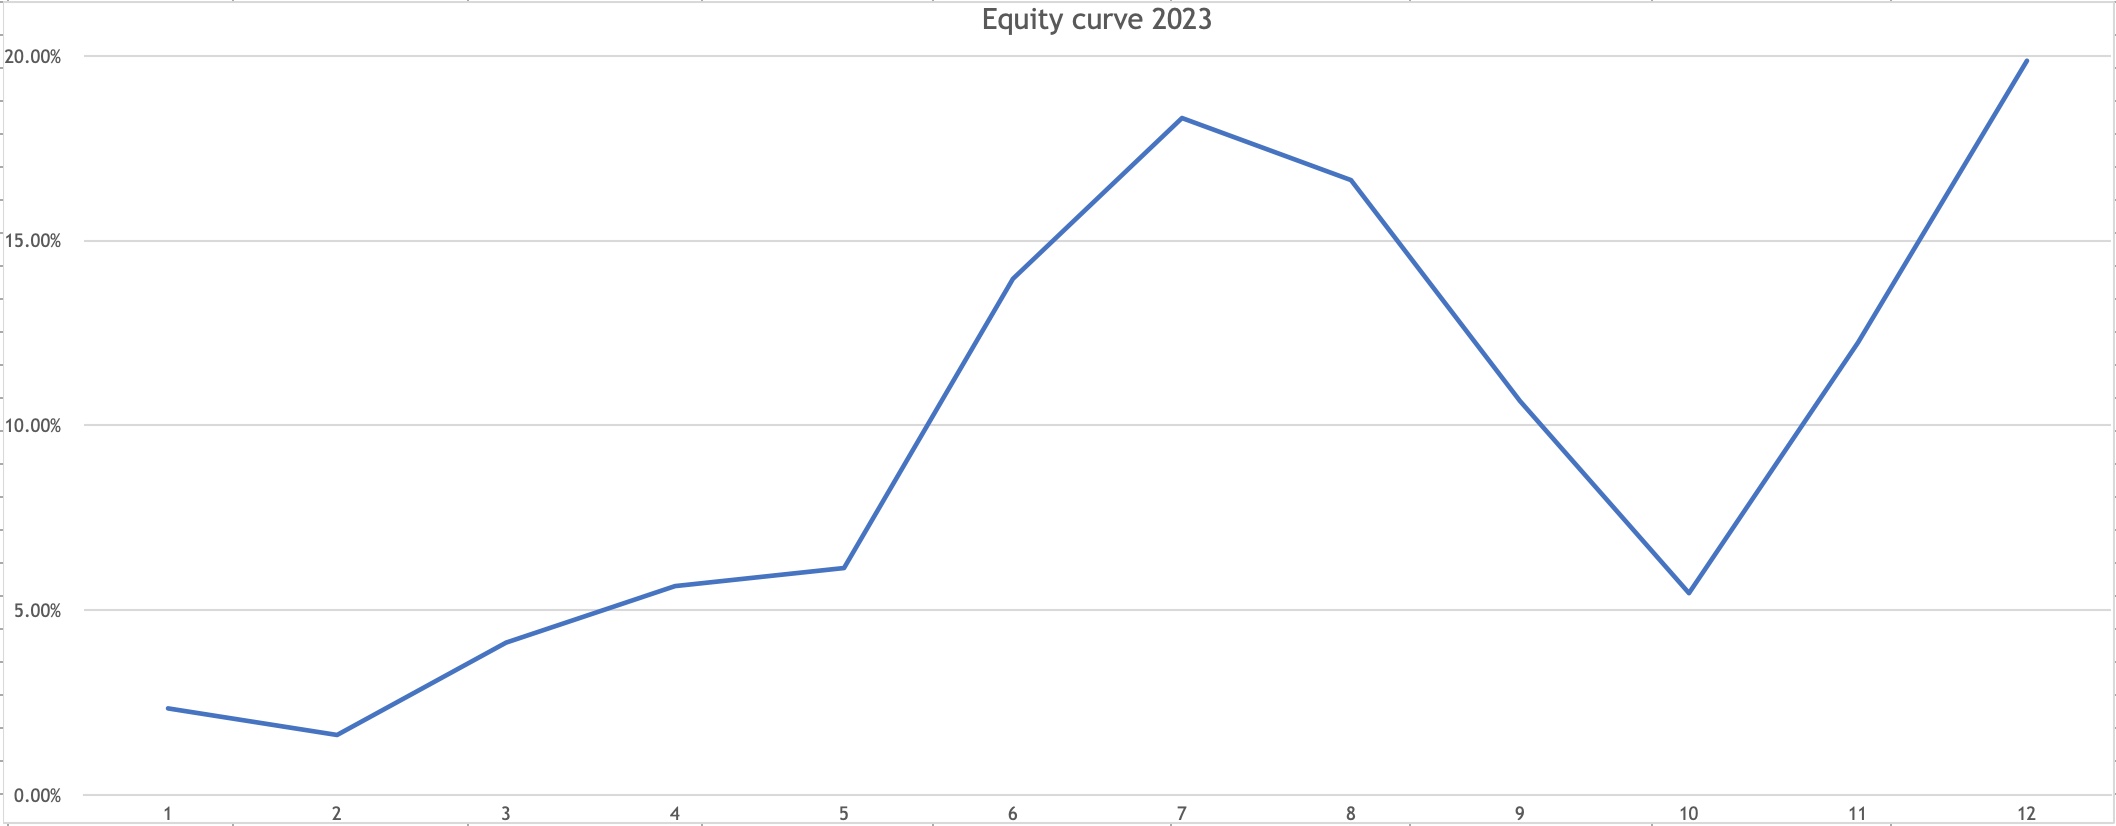
My overall return at the portfolio level was +19.9% in 2023. See the monthly chart below.

It’s a great visual representation of lumpy returns. I gave back a big chunk of my 2023 profits by the end of October, but continued to follow my process and push the buttons the way I’m expected to. I made everything back plus more in the last two months of the year. Trading is not a smooth stable ride if you want good performance. I need to tolerate risk and volatility to achieve my expectations. No emotions, pure math and odds. That’s also one of the reasons I don’t want to look at performance too closely every week or month. What’s the purpose of creating stress at the end of October, possibly interfere with the trading plan in case I was a discretionary trader or just couldn’t follow my system due to psychological issues. It’s a mind game. I’ve learned to manipulate my brain so it doesn’t ruin my chances to make money. That’s the reality of trading the markets, not clean lines going straight up what is advertised to the public. No pain, no gain. The whipsaw market in late autumn took away a possibly great year for my trading system, but I still ended the year pretty well.

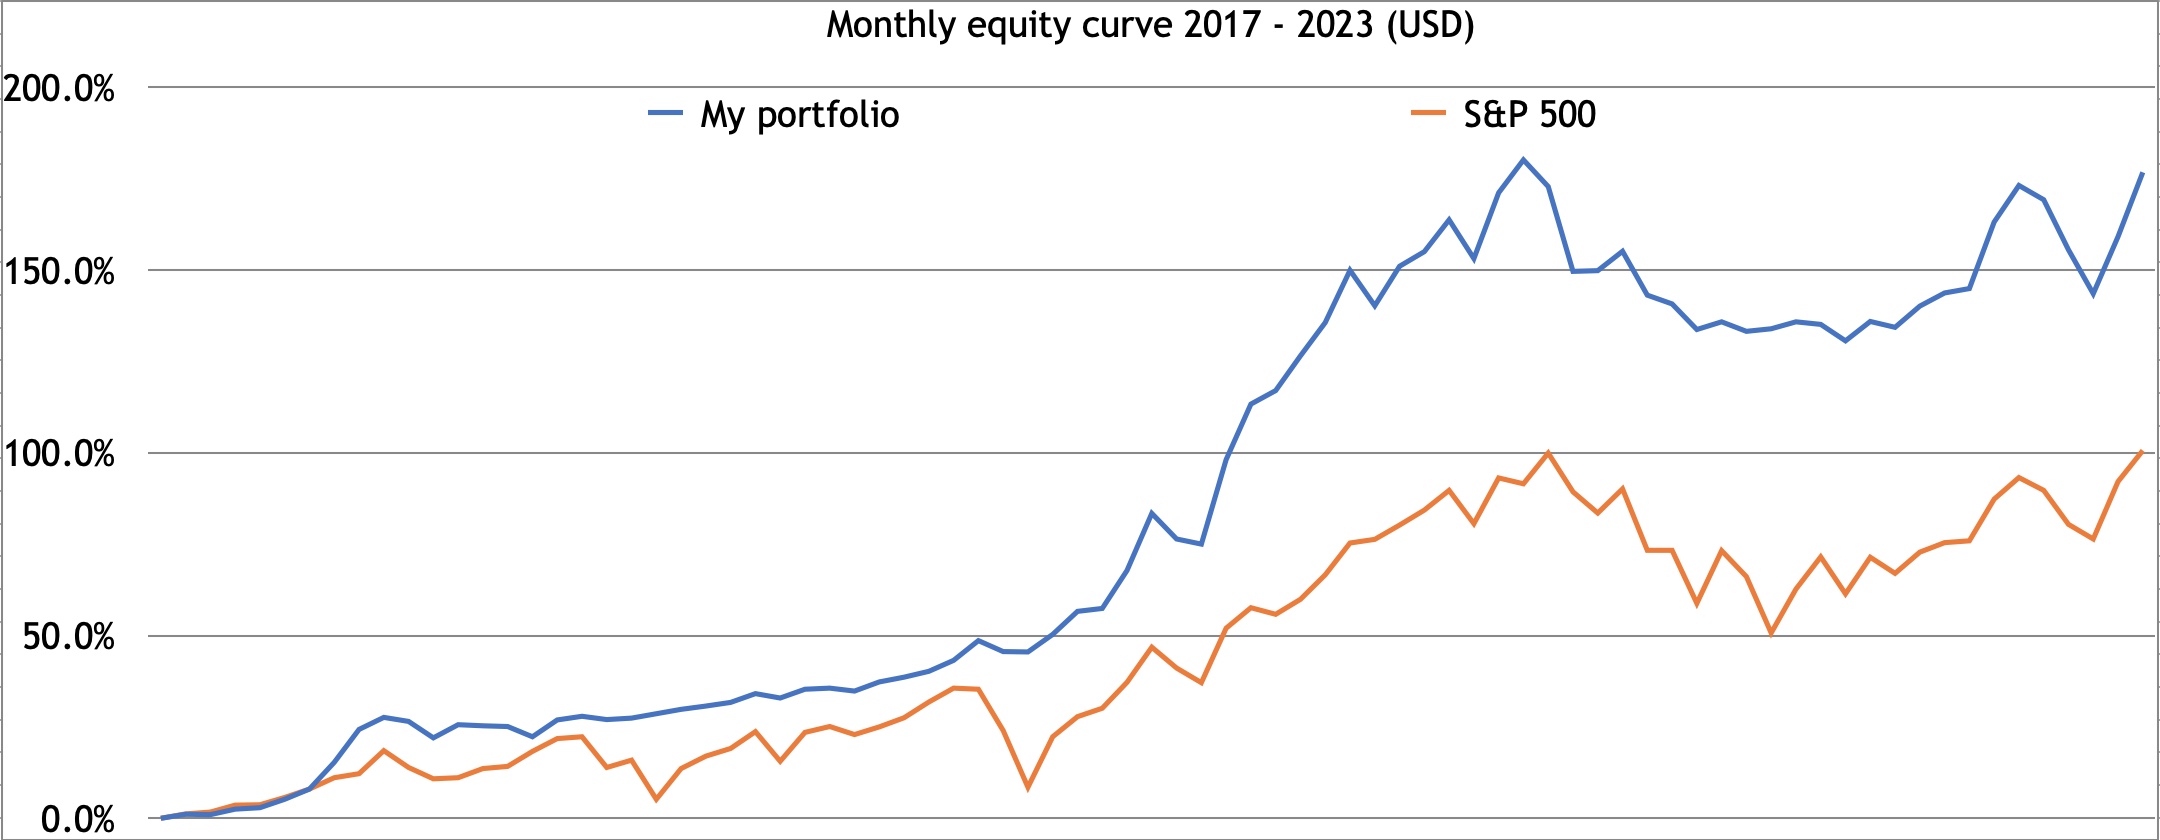
I updated the equity curve since 2017 together with S&P 500 index. One idea going forward is that I’d like to be less correlated to the benchmark, meaning the equity curve should follow less what the overall market is doing. More short-term strategies besides long-term US stock trends help to achieve this, and I’m working more on hedging market corrections these days that could in theory make the ride a bit smoother, but I don’t want it to be so smooth that it starts to harm absolute performance.
Now onto 2024!
Share this post