Blog
Sequence of returns risk: Why your retirement date matters
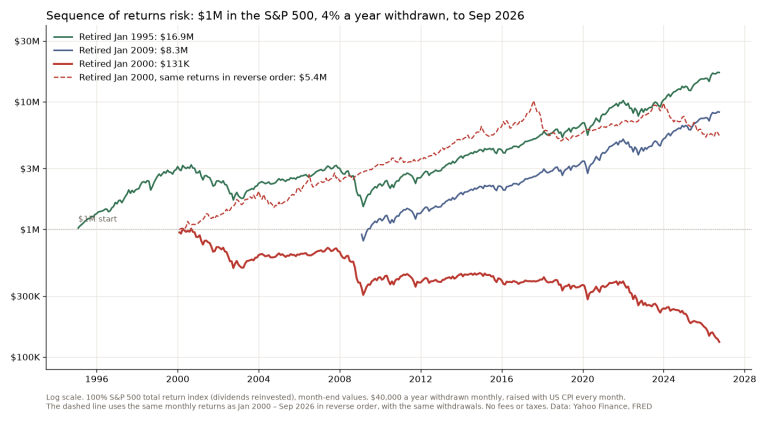
Sequence of returns risk is the danger that bad years come at the start of retirement, while you are taking money out. I ran it on real S&P 500 data…
Essays on trading psychology and method, chart reads and market notes, since 2018.
96 posts · page 1 of 16Sequence of returns risk is the danger that bad years come at the start of retirement, while you are taking money out. I ran it on real S&P 500 data…
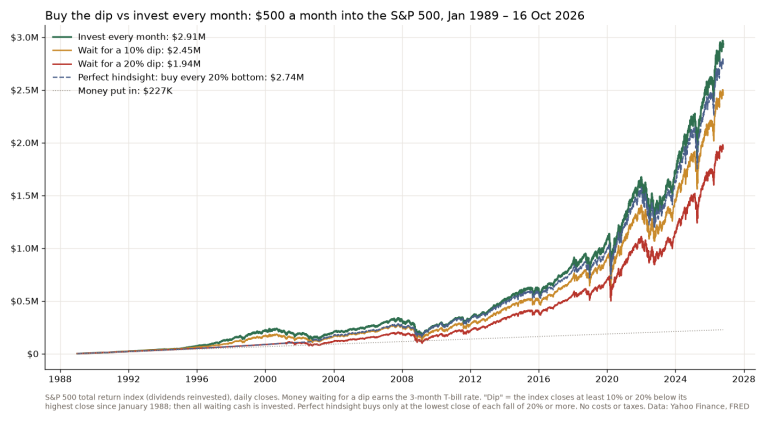
Buying the dip means keeping cash aside and investing it when the market falls. I tested it on the S&P 500 with dividends since 1989: $500 a month…
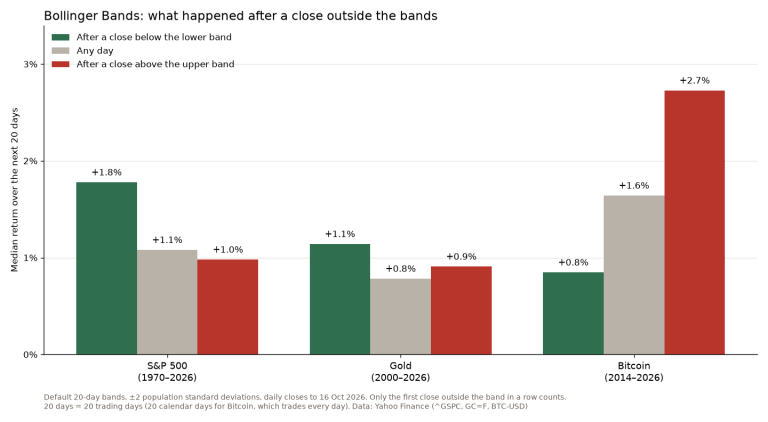
Bollinger Bands are a 20-day moving average with a band two standard deviations above and below it. I tested John Bollinger’s own rules on the S&P…
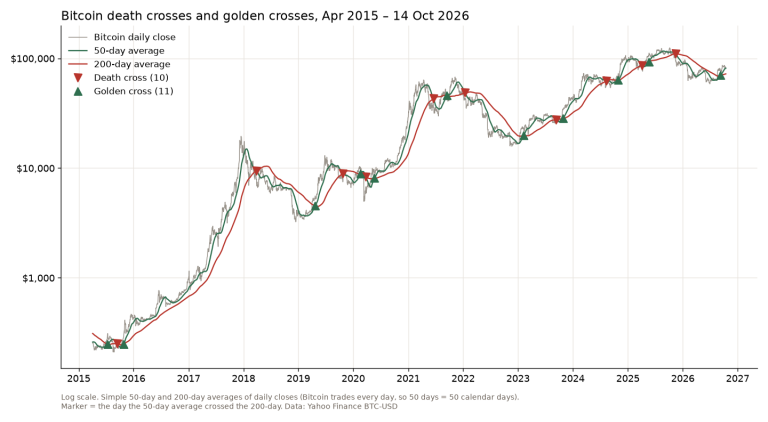
Bitcoin has had 10 death crosses since 2015, the days its 50-day moving average fell below the 200-day. A year later the price was higher after 5 of…
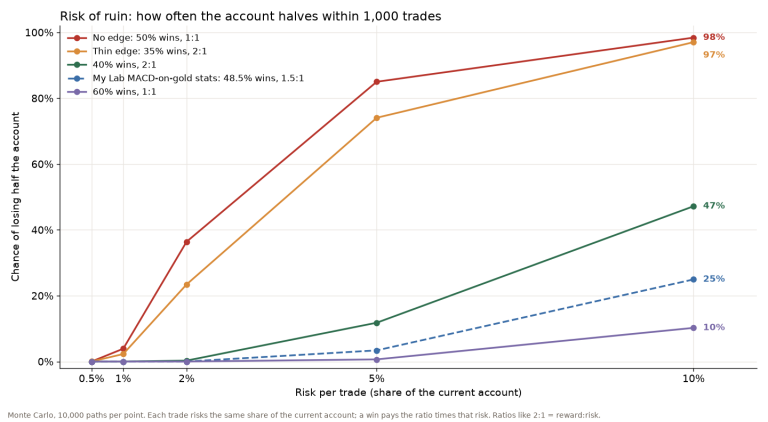
Risk of ruin is the chance that a run of losses takes your account down to a point you can’t come back from. I simulated 1,000 trades, 10,000 times…
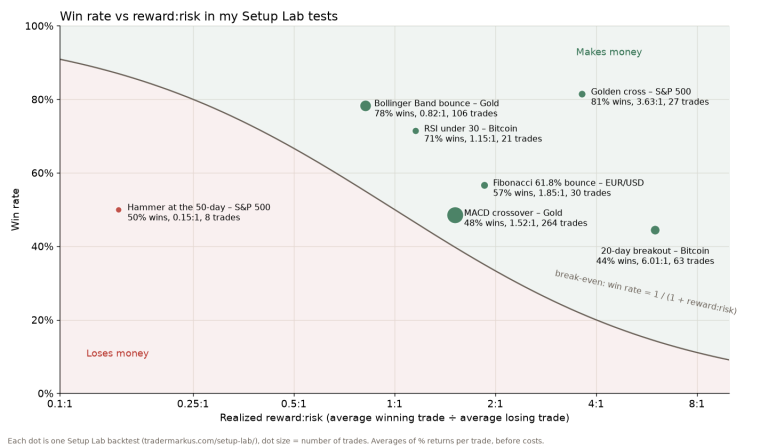
The risk reward ratio compares what a trade can lose, from the entry to the stop, with what it can make, from the entry to the target. Risk $1 to…
Type a word or a book title. Titles, excerpts and tags are searched.