60 min read
If you are new to trading or haven’t found consistency yet, but want to get serious and learn to become successful, then you can spend an hour reading this essential free information I have published for aspiring traders.
I have compiled the content into four main sections:
– FIRST STEPS
– REALISTIC EXPECTATIONS
– STYLES OF TRADING
– BECOMING A TRADER
This page represents my opinion and does not consider your objectives, needs or financial situation. The content is meant to be informational and should not be used as trading advice. I make no guarantees related to the claims contained herein. Before acting on this writing you should consider the appropriateness of the content in regard to your own situation. Please trade responsibly.
FIRST STEPS
First and foremost, you need to decide if you are willing to dedicate time and energy to trading and you aren’t just looking for the “easy money”. You need to make up your mind that it’s the path you choose, because a winning mindset and persistence are necessary when hard times kick in and you think of giving up, which is a matter of time, so it’s better to be prepared from the start. Trading is hard but can be very rewarding.
I have listed frequently asked questions of beginning traders. Click on a question below to open up the answer.
Timeframes
How much time do I need for trading?
The trading timeframe will be chosen by how much screen time you want to put up. If you have a day job then you won’t be able to day-trade. Do you have family and kids who you want to pay attention to after work? You need at least an hour or two of quiet private time each market day if you want to swing trade. In case you can afford only an hour or two every weekend, then you can be a position trader who has a longer-term perspective, gives trades more wiggling room and holds positions longer. Beginning traders often think that the more they trade and the quicker they can grab profits, the more money they make. That is not true. Position traders who ignore daily market noise can have just as good returns as active swing traders.
How often am I going to make decisions?
Think of your timeframe for making decisions and holding positions. Is the market going up or down? Well, it could be going up on weekly chart, down on daily, sideways on hourly and up on 10min chart. Each timeframe is in its own market move and therefore a trader must understand which perspective he or she is looking for.
If you want to make long-term decisions on weekends, then I suggest you pay most attention to weekly charts where each bar closes on Friday. You may still fine tune entries and exits on daily chart but the main focus should be on the weekly close. In case you want to be more short-term and swing trade by managing positions on a daily basis, then your main chart becomes the daily. You may add hourly chart to fine tune entries and exits but stick to daily chart when planning a trade. Day-traders go even lower on timeframes. I used to day-trade on hourly and 10min charts. Rarely I added 2min chart to fine tune entries and exits but my main focus was on the 10min chart.
Once you decide on your charting timeframes, stick to it! Trading the daily chart but then randomly going down to 10min chart intraday just to create useless emotions is a very bad practice that will cost money. You will start to chase trades and exit prematurely on timeframes that don’t have any meaning to your initial trading plan and is just plain market noise. Market noise is random buying and selling activity that moves price up and down in a scale that doesn’t affect your trading signals, hence has no meaning to your positions.
What timeframes should I choose?
I started swing trading using weekly, daily and hourly charts. I used to day-trade using hourly, 10min and 2min charts. My trading went easier and results better when I ditched the third chart. Today, I don’t day-trade and I use weekly and daily charts for position and swing trading. I never go down to intraday charts because there is unnecessary market noise for my strategies.
I suggest picking two timeframes that differ by 4-6 times. For example, either monthly and weekly charts (position trading), weekly and daily (position and swing trading), daily and hourly (swing and day-trading), hourly and 10min (day-trading) etc. It should depend on how often you want to make decisions, for example picking hourly chart I’d assume you can watch the screens at least once an hour when another bar closes to make trading decisions.
I don’t want to look at screens intraday so I use the daily chart to make my decisions once a day when the market is closed. So, the longer-term chart (in my case weekly) is my strategic chart where I decide to be long or short, and the shorter-term (in my case daily) is my tactical chart where I make entry and exit decisions.
Returns
How much money can I make from trading?
Most new traders have unrealistic expectations that will create useless emotions when not achieving what is almost impossible anyway, and would need pure luck to accomplish. This is probably influenced by false information online, where marketers pretend to be traders and use two ways to manipulate with returns.
First, marketers show short-term results of a single day or week that have no meaning over a longer period of time because returns fluctuate for every strategy and style. I could pick my best days and show superb performance that would theoretically make me a billionaire in a few years if compounded. Think again.
Secondly, traders manipulate returns with account size. Imagine someone showing the returns of a $10k account while having $1M of total trading capital versus you starting out with the whole $10k to your name. You’ll never be able to take same risk and grow an account the way another person can due to having much more capital on the side. A lot of survivorship bias is involved because the guru can blow up several $10k accounts while you can’t afford it. I could show each trade as a separate account and pick a few of the best, which would theoretically make me a billionaire in a few years if compounded. Think again.
In reality, if the average annual return of the world stock market over a long time period is around 7% and most fund managers are not able to beat it, then each percentage point over the average would be considered as a good return. If a trader can consistently beat the market average by double, that is gaining 14% average annual return through the whole cycle of bull and bear markets, then this is excellent. Be aware of the meaning of “average annual return”. You won’t make 14% each year, but instead the annual returns would look something like 28%, 0%, 30%, -5%, 10% etc. The marketing guys who promise triple digit returns every year or even quicker, are not doing it themselves. There is much manipulation by showing short-term returns or only the best working trades and hiding the losing ones to sell education that will not help you as a trader. You need to get your expectations right.
What expectations and goals should I have?
When starting out with trading, I think one should have no monetary expectations at all. It is irrelevant at first how much money you make, it’s much more important to develop a sustainable process and proper mindset to be able to make money in the long run. If you focus on short-term results it will be nearly impossible to succeed in the long run because markets go up and down, your trading will do the same together with the equity curve, and it’s hard for human brain to tolerate it. No trader can avoid losses and zig-zags in the equity curve. What you need is a concrete plan to constantly keep placing odds in your favor and manage losses. Focusing on the process over outcome in short-term and knowing the odds of your trading activity will bring success in long-term. This kind of thinking is called the trader’s mindset.
How much return is considered good when starting out?
I would say if your account is down less than -10% after the first trading year, then this is normal. If the account is flat after the first 12 months of trading, then it is good. Everything above the 0% is considered good and over 10% excellent for the first trading year. However, there can often be more luck involved, for example if the first year ends up being a roaring bull market which brings excellent returns, be aware of it and acknowledge that it probably won’t last. Consistent above market average returns usually come after 3-5 years of consistent trading and learning. Many new traders won’t last financially or psychologically to see the better times. This is why it’s important to start slow and build up your trading business step by step. It takes time and commitment to gain confidence. At first, it may feel hard but the more screen time you put up, the more experience you get, the easier it becomes week by week. Don’t think of the money and returns at first, try to develop a proper process and strategies that you understand.
How much return can a successful trader expect?
Beginning traders often ask about it. When we think about trading strategies and returns, we also need to consider drawdowns and volatility. A rule of thumb is that a strategy that makes average annual return of 20% shouldn’t have much deeper maximum drawdown than 20%. Another strategy averaging 50% annual return could also come with 50% drawdowns. So, a ratio of 1:1 in terms of return and maximum drawdown can be considered good. Anything better than that in favor of return is excellent. While drawdowns look much better on paper, one must understand that in real life a trader never knows how much deeper a drawdown may go and how long one takes to recover. A trader must also consider the risk of ruin when handling deep drawdowns. If you go into a 60-70% drawdown, the account may never recover if the strategy goes out of sync with the market and the losing streak continues. So, it’s not just about the higher return the better. One needs to understand drawdowns, volatility and risk of ruin. My own semi-passive trading system is built for average annual return of 20% with drawdowns a bit less, but as future is out-of-sample data we never actually know what the deepest drawdown in the future will be.
What is your own goal in trading?
My first goal is to follow my trading rules and the process. I know that in short-term I will take punches from the market but if I stick around, cut my losses and keep putting odds in my favor, I will make good returns in the long run. Obviously, my second goal is to earn risk premium in the stock market that would bring higher returns than the market average. But this is not something I can control. It is about following my strategies I have put in place that help me to achieve it. Nobody knows what the future will bring in the markets but I follow my plan and let the odds play out. Another important factor is that I keep enjoying the process and take the challenge as a game rather than just making money. Process over outcome and cutting losses while they’re small – my main objectives!
Capital
How much money do I need to start trading?
A beginning trader’s goal is not to make money but to learn to trade and develop a process to start making money along the way. Winning and losing creates emotions and therefore trading too large in the beginning will most probably end with a negative experience. But you need to trade with real money to learn about these emotions. I recommend to start trading with at least couple of thousand dollars but not more than 10-20% of your liquid assets. Many traders who become successful blow their account up several times before, meaning they lose all of their account’s value. Be prepared for that. Learn risk while your account is small.
How much capital do I need to trade for a living?
When reminding about the unrealistic expectations many beginning traders have, the couple of thousand dollars account won’t pay your bills. Trading is not a job where someone pays you for taking trades. There is no such thing as consistent weekly or monthly (or even yearly) income in trading. Markets move up and down, change regimes and therefore your strategies perform differently in time. An experienced trader is aware of the fact that he or she could have a flat or even a losing year and not make any money. Traders have usually saved enough money to cover life expenses for several years without depending too much on trading income. Every trader’s situation is different and the amount of money you need to trade for a living depends on the family situation, other income streams, cost of living expenses etc. I think one should have at least a $100k account to trade for a living. You can’t expect to be doubling your money every year and you need to survive at times when your strategies are out of sync with the market. Trading a small account and having everyday life depend on it, is a very stressful experience.
Risks
How much money should I risk per trade?
This varies for strategies but my rule of thumb is that I never risk more than 1% of my trading account per trade, and often it’s even less because I don’t allocate money into parts for different strategies, but manage it as a single pool of capital. Risk per trade does not limit the size of the total position but is the amount I’m willing to lose when a trade doesn’t work and is stopped out with a loss. For example, if you are trading a $100k account, you shouldn’t risk more than $1k per single trade, meaning the dollar distance from the trade’s entry to protective stop loss, multiplied by the amount of shares you trade should not be more than $1k. I calculate my position size by reversing the idea: if risk per trade is $1000 and the dollar distance from entry to stop loss is $5 per share, then I can trade 1000 / 5 = 200 shares. In my experience, the 2% rule presented in most trading books is too much risk, but it really depends on the timeframe and characteristics of the strategy. The wider the stop loss, the higher the dollar risk could be because win rate will be higher and holding period longer, hence less trade frequency. So there isn’t a right answer that fits everyone, and it needs to be tested. However, it’s better to start with less risk than too much of it.
How many open positions can I have to keep portfolio risk in check?
There is no secret formula but I limit total portfolio risk up to 20% at any given time myself. Most of the time the total risk of my portfolio fluctuates between 10-20%. Every trader needs to decide how much drawdown they can stomach and find the balance of how many total positions to have. Here are my thoughts about it.
First, if a 20% drawdown feels okay on paper then you probably start to feel bad at a 10% drawdown. Remember, a drawdown in a backtest on paper will always seem less worrisome if you can see how it recovered. In real life, we don’t know how long the drawdown and recovery will last.
Secondly, you want to diversify and not put all your capital into just a couple of stocks or couple of sectors. However, you don’t want to over diversify because having 500 stocks in your portfolio mitigates risks but also dilutes returns. I think the sweet spot is having around 20 positions at a time. This means you have enough diversification that a 50% decline in a single stock won’t put you out of the game, because having 5% of your account lose half of its value affects the portfolio by 2,5% which is possible to recover. However, if one stock out of 20 makes an outlier move in your favor, you’ll still see the benefit for the whole portfolio, which wouldn’t be the case with 500 positions.
All in all, how many positions and total risk a trader should have at a time depends on the style of trading and strategies. Day-traders usually have less positions but build them up bigger using partial entries and exits, because the game is much faster and there’s less room for error. They also have more control over the positions because the account will be fully in cash at the end of the day. Long-term position traders don’t need to time the market that much because a penny here or there will have no impact on the overall outcome. Swing traders who hold a position from a few days to a few weeks fall between the two. You need to be able to manage all your trades, but check the positions as infrequently as needed by the strategy.
If you are just starting out, one good rule is not to have more than 6% of the capital at open risk. This allows you to get experience and feel comfortable with risk without getting over leveraged.
What kind of drawdowns should I expect?
A drawdown is the decline in equity from peak to trough before recovering and taking out the peak again. One of the main differences between swing and position trading besides work time is the depth of drawdowns – position traders usually need to tolerate deeper drawdowns than active swing traders who are quicker to cut losses. On the flipside, a swing trader will have more trades, that means more screen time, more decision-making and more often pain from realizing losses. It’s important to decide it on your own personal situation and not because of someone else suggesting one or another style to trade. There is no best option, it depends on your own personality, too.
Day-traders need to make a lot of quick decisions, which is stressful and tiresome compared to a weekend trader who looks at the charts once every week. So decide how much screen time you are going to have and stick to it. Don’t look at the markets intraday if you’re an end-of-day trader, and no need to monitor positions daily if trading decisions are being made after a weekly bar has closed on Friday. Drawdowns are one of the reasons why trading is so much more difficult than buy-and-hold investing. Investors know they are not going to exit when price fluctuates up and down, they see the drawdowns on paper but don’t actually take them. Traders need to consistently realize losses that is to actually take the loss and digest the feeling of giving cash away.
If you can develop the trader’s mindset that there is no difference if the account value is measured by open or closed positions, you will have a much enjoyable time trading the markets. Just like an investor waits for the market to come back up by staying in the position, a trader waits for the strategies to come back up in terms of equity by staying loyal to the trading activity.
Markets
What markets should I trade?
You need to think of the universe of assets to trade. Most traders start with stocks or currencies, nowadays even crypto but there are also commodities, bonds and other assets. I am a stock trader myself but I hedge my account’s dollar value with euros, gold and bitcoin. I trade US mid and large cap stocks. Something else may suit you. It depends on your timezone, brokerage options, fees, account size, trading style, information edge, professional expertise, personal choice etc. I am going to provide information and examples about the stock market because this is what I have most experience in, but you can apply the process and technical analysis on this page to any market that has price data.
Does liquidity matter?
I trade liquid stocks that have at least $10M of average daily volume. You can trade less liquid ones but the rule of thumb is that your position size should not be more than 1% of the daily volume to be able to get out quickly. This means that if you are going to take a $100k position in a single stock, it should have at least $10M of daily trading volume on average. If you trade smaller, let’s say a single position is $10k, then you can trade something that has average daily volume of $1M. You don’t need the liquidity until you need it the most and then it’s usually the hardest to get. This is why it’s important not to trade illiquid markets where you can get stuck, or move the price yourself when trying to get out. Most traders underestimate the need for liquidity until they face a situation of a rapidly falling asset they can’t get out of, because everyone is running to the exit.
Documentation
Why should I document my trades?
First, trading should be treated as a business. You need to know details about your trades to analyze your edge and evaluate the process. When trading your own capital, you are your own teacher. Documenting all trades with charts allows you to go back later and see how you managed trades. At the beginning of each quarter I look back at my trades from the quarter previous to the last one, to study entries and exits in the middle of the chart. Take notes of your mistakes. It’s the best way to learn from them!
Many traders also document their emotions and feelings when taking a trade. This is especially beneficial for day-traders who are constantly in the heat of the battle making decisions during market hours. Of course, you don’t have time during day-trading to take much notes but you may do it after the session. Documenting your trading may feel boring but most of the work is done in preparation! Trading the markets (submitting orders) is only the execution of a thorough plan and should take the least effort – something amateurs pay most attention to while looking the price move tick by tick. Don’t do it.
What do I need to document in trading?
I am writing of my own experience. First, I have written down all my trading strategies in a file. I only trade by the rules of my strategies. If a stock doesn’t meet my strategy then I skip it.
Secondly, I keep a spreadsheet of all my trades: ticker, strategy, long / short, entry date, entry price, quantity, notes and updates, stop price, target price, exit date, exit price, gain / loss per share, fees, total gain / loss. In that file I also keep a separate sheet for each ticker I’m currently trading with more details: ticker, earnings date, entry date, strategy’s checklist, entry price, stop price, target price, quantity, risk per share, total risk, notes and updates. This helps me quickly navigate through my open trades and manage my positions.
As a third file, I keep another separate spreadsheet to journal all trades with charts. There I only add the ticker and prices with entry and exit charts by each month. When I go back and study the charts in hindsight, I also add a follow-up chart where the entry and exit are in the middle of it and can be analyzed better.
My fourth document is to keep track of my equity curve. I update it once a month and it shows my monthly returns on a chart. This is necessary to see that my strategies are performing as expected and the zig-zags of the equity curve are pointed in the upward direction. You want to see a smooth upwards equity curve with occasional pullbacks.
The fifth document is my weekly homework where I write about the current market situation once a week to keep myself in sync with the market. This is how I do it. You may have your own way to document trades, there’s no right or wrong answer, but it’s important that you do it and it should make sense for your own process.
Psychology
Why does psychology matter in trading?
There are some facts about trading psychology that you need to understand when starting a trading business. Money creates emotions like greed and fear because money symbolizes power and more money means better living conditions. People work for money and they hate to lose it. We all have limited capital.
However, you can’t think of your trading capital as purchasing power in a store if you want to be successful in trading. You need to think of your capital as chips at a poker table – you don’t want to lose all your chips because then the game is over, but you need to risk your chips to continue playing. Your trading account will not grow in a straight line, it will have ups and downs, all kinds of bumps along the way. It is even normal to temporarily lose 20-30% of your account’s capital if you are serious to trading.
What makes pros differ from amateurs is that they know these drawdowns are inevitable, temporary and recover if you have a trading edge and can follow it with strict discipline. The account value going up and down is part of trading. If you can’t handle it, it will be very difficult if not impossible to become a successful trader. If you don’t have these bumps along the way it means you’re not taking enough risk to fulfill the true potential.
How to avoid emotions in trading?
I’ve been practicing meditation to clear my mind and learn to manage my thoughts. You can’t eliminate your thoughts and emotions because we are all human. But you can train to manage your thoughts and not let them turn into action that affects your trading decisions.
I used to do this practice daily. I close my eyes, concentrate on breathing and don’t think of anything. Random thoughts are going to pop up in my mind, like what I’m going to eat later, what emails I need to respond to etc. I don’t try to suppress these thoughts, I accept them but let them go and bring my mind back to breathing. I started out meditating for 10 minutes each workday and added 2 minutes to it every week until each session became 30 minutes long.
Start short, daily consistency is more important than the length of a single session. It will train your intuitive mind and make you a more rational, calm trader. The idea is to learn to keep focus on charts (breath) while trading and not let any emotional thoughts come in that would make you deviate from the trading plan (letting thoughts go).
How can I fight stress of losing money?
First, I know the statistics of my trading strategies so I can become comfortable with expected losses. Secondly, I take trading as a lifestyle. I keep myself fit and healthy, then I’m a happy person and it also benefits my trading because there’s no stress in life. There are some habits I follow, like cold shower in the mornings, workouts several times a week, healthy meals, being social etc. You don’t want to get obsessed with trading and money, there’s much more to life! With such positive mindset, success will follow.
Why does the market always do the opposite of what I’m anticipating?
The market often seems to be hurting us on purpose. Just when you decide to put a long position on, the price starts to fall; or you sell a long position and the stock continues to go higher and higher just without you in it. If you’re following a trading plan and not just gambling, then most probably such occurrences are simply random and you remember the bad ones instead of the other occurrences, where the trade started to work right away. There is no other solution than to work on your trading edge and find out if your entry and stop placement could be applied better, but often it’s just something to accept as part of market randomness. We can’t always be right and need to accept to be good enough. You should definitely avoid having revenge on the market or try to win that loss back right away in the same instrument without a correct plan. Such undisciplined behavior is destructive to the trader’s mind and account. Avoid trading your profit and loss figures, keep your focus on charts! Remember, it’s not about short-term profits, it’s about managing your trades according to the plan and letting the odds play out in long-term.
Why 90% of traders lose money?
Besides not having a plan and risking too much per single trade, I think psychology plays a huge role in successful trading. Having carefree state of mind is so important because the success of a trading business will depend on the weakest link, which is our human nature. People hate to be wrong, especially when it comes to losing money. Losing equals failure in our society. In trading you need to embrace small losses and let profits run. You must be able to realize losses while they are small, suck it up and continue to put on new trades. It’s the only mathematical way to stay consistently profitable in the long run. If you let your losses out of control, the winnings won’t be able to cover these large losses and there is no way to make money. You need to learn to lose if you want to be a trader! Therefore, all traders have losses, but the 90% who don’t become profitable try to avoid losing, so they lose even more in the end.
Why is it so hard to follow a trading plan?
If you keep getting caught up by emotions and deviate from your trading plan, that is to take profits sooner, give more stop room to losses, skip trades out of fear or over-trade out of greed, then you need to come back to the trading plan to go over two points. First, you probably risk too much and this is making you break the rules. Cut back your trading size! Secondly, you are probably not confident in your trading method. Paper trade, backtest on historical data, trade small and gain screen time. There is no other way to do it, really. You need screen time to get experience, and slowly build up your risk size to gain confidence.
REALISTIC EXPECTATIONS
Trading can be a side business to raise living standards. Don’t rush to leave day job to become a full-time trader. This is not a consistent income stream, you need capital to live through drawdowns. Expect to earn nothing for a year. Even the best traders go through drawdowns. It’s a necessary function of risk to earn excessive return. It’s about how you can live with it, survive and still keep trading. It’s important to start but to do it small and scale up together with experience. I think one needs at least $100k to trade for a living but it’s the absolute minimum in my opinion. You want to grow your account besides paying the bills. 15-30% average annual return over a long time period (20 years) is good. This is earning risk premium. Day-traders should expect more, around 50% average annual return because they put in the time that should generate activity premium. But then it’s a full-time daily job with a lot of stress and the need for strict discipline. Day-traders go for higher returns that also come with higher competition. Don’t expect to start trading with $2000 and become an overnight millionaire. The chances are slim to none. Returns come with risk. Risk creates stress. I have chosen the more passive and systematic way to let the markets work for me and accumulate risk premium over time that would grow thanks to compounding. I can enjoy life and not stare at screens. Expect to study the first 2-3 years and become a competent trader after several years of practice. In order to earn a consistent income from the markets, you must first become consistent in your process. It’s not about making money at first, it’s about creating your personal process to follow.
Most people are terrible at making trading judgements on gut feel. The market always seems to be out there to get you. In reality, the market doesn’t know of your existence or your decisions. The market is the mass of participation, buyers and sellers coming in every day. It’s because most people make decisions based on the flaws of human nature that make these same decisions end badly for most participants. This is why you need to differ, and you need to have rules. Rules will help to avoid acting on emotions and human flaws. Then it becomes a struggle to have discipline to follow the rules. If you can, then you will succeed.
Market edge
Market edge means positive expectancy in trading to make excessive returns that beat the market average. I don’t compare my performance to a benchmark too often because periods of outperformance are followed by underperformance, so one needs to look at the bigger picture and measure returns on a long-term timescale. A trader needs an edge that would make his or her trading efforts pay off, otherwise one could just hold an index ETF and get the average results. I don’t want to wake up and tell myself that I’m average, I want to be better. I apply this mindset to different parts of life including trading.
Most beginning traders think that the edge lies in which stock to pick or where to enter a trade. Entry is just a small part of a trading edge to me. In fact, it’s even more important where you exit a trade that locks in the result of that trade. Either it’s going to be a loss or a winning trade, the exit will decide how much a trader loses or wins. But it’s not about a single trade that gives me my market edge. Once I have set my entry and exit rules that provide me asymmetrical opportunities meaning my losses are smaller on average compared to my wins, it’s then about risk management, position sizing and trade frequency. The outcome of a single trade is random but a mathematical trading edge will work out for the next 100 trades. So I don’t try to predict my next trade, but I trust my tested edge and try to get as much trade frequency as possible utilizing this edge to be profitable over a bigger sample size. Even if we think about a coin toss that should be 50% head and 50% tail, they won’t come in a normal distribution meaning you may have 4 heads, then 2 tails and again 5 heads in a row. The same logic applies to trade distribution. I may have 50% win rate but I never know the result of my next trade. However, limiting losses and allowing winners to be double or triple the size of losers, I am creating myself a positive expectancy in the market. You need to think in probabilities because the markets are always uncertain. My goal as a trader is not to be right, but to make money. I can be wrong half the time, but keeping losses small allows me to be profitable.
Next, I’m sharing some thoughts about charts and technical indicators that can help to develop entry and exit techniques to find a market edge.
How to find edge
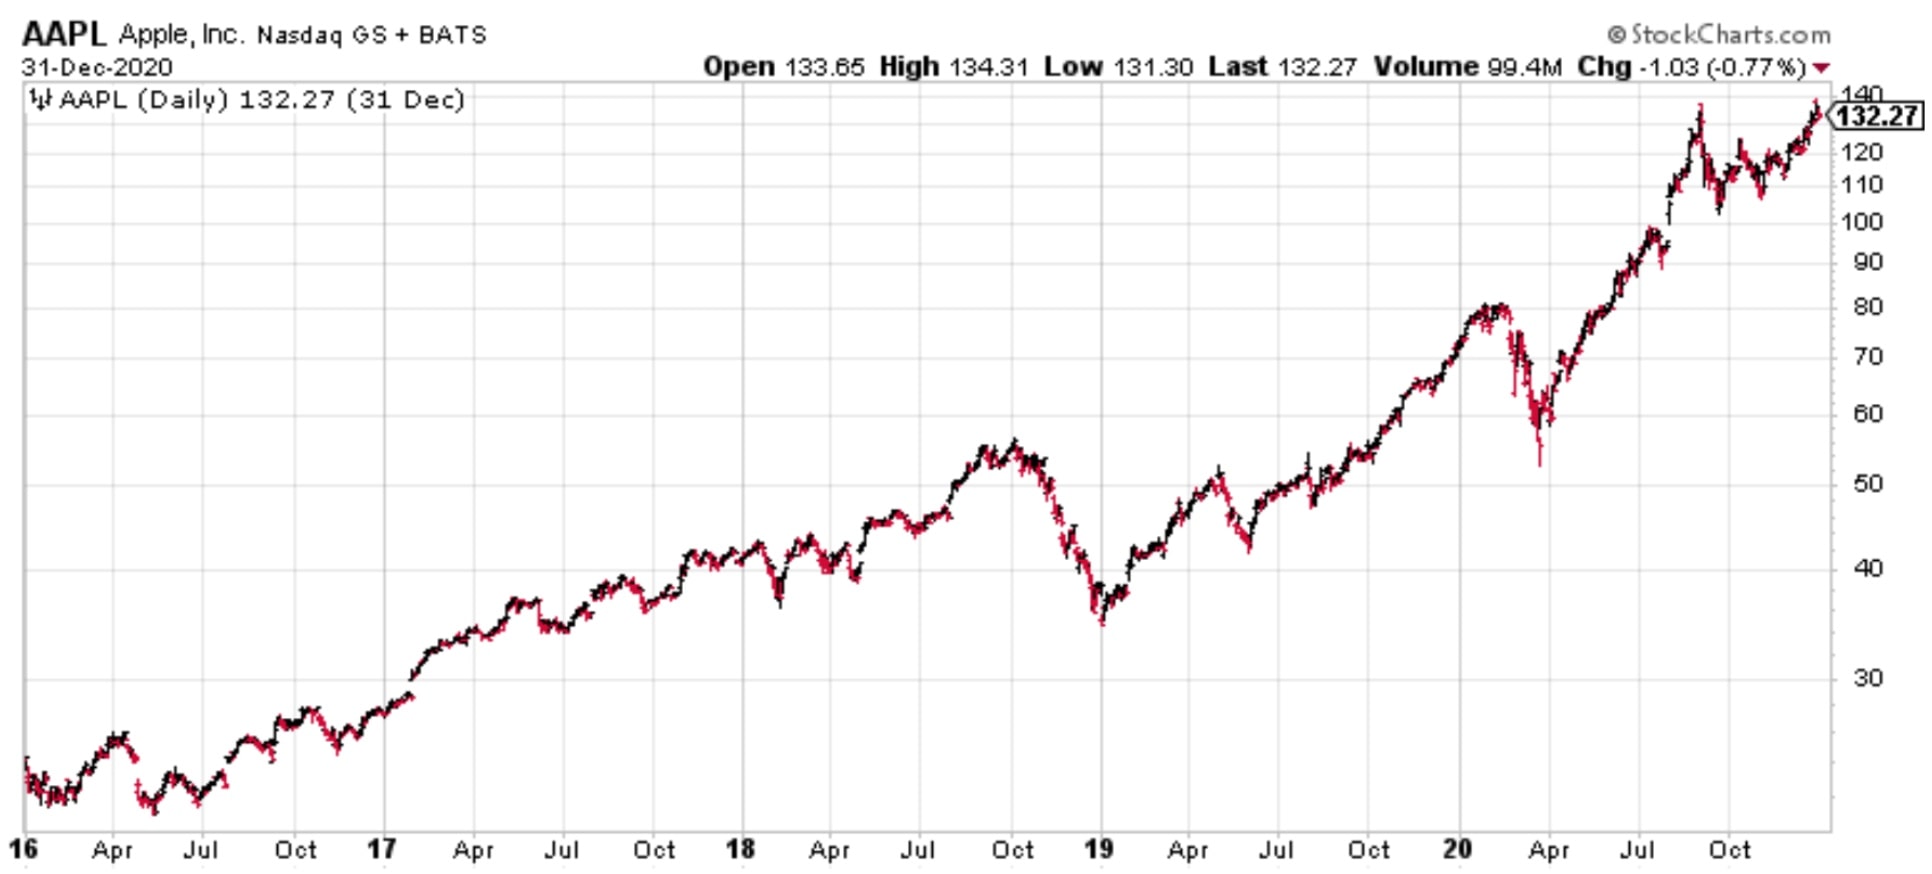
Let’s look at the daily chart of AAPL from 2016 – 2020. Imagine you bought the stock at the left side and held through the five-year period when Apple’s stock price gained +440%.
However, along the way there were -38%, -34% and several -20% drawdowns that the buy-and-hold investor had to hold through and tolerate. It’s never guaranteed that even a popular stock will recover and continue to go up. What if AAPL goes into a long-term downtrend? Will you hold on to it forever hoping it goes back up? Look at the chart how price moves. There are zig-zags, up and down swings in trends. For a trend trader (position trading) the smaller swings continuing in a direction are market noise. Swing traders trade these swings. Intraday price moves are market noise for swing traders. Day-traders trade it. So you need to understand your own timeframe. This will determine how often you make decisions, how much room you give a position to run before getting stopped out or taking profit, and how long a position will be held on average.
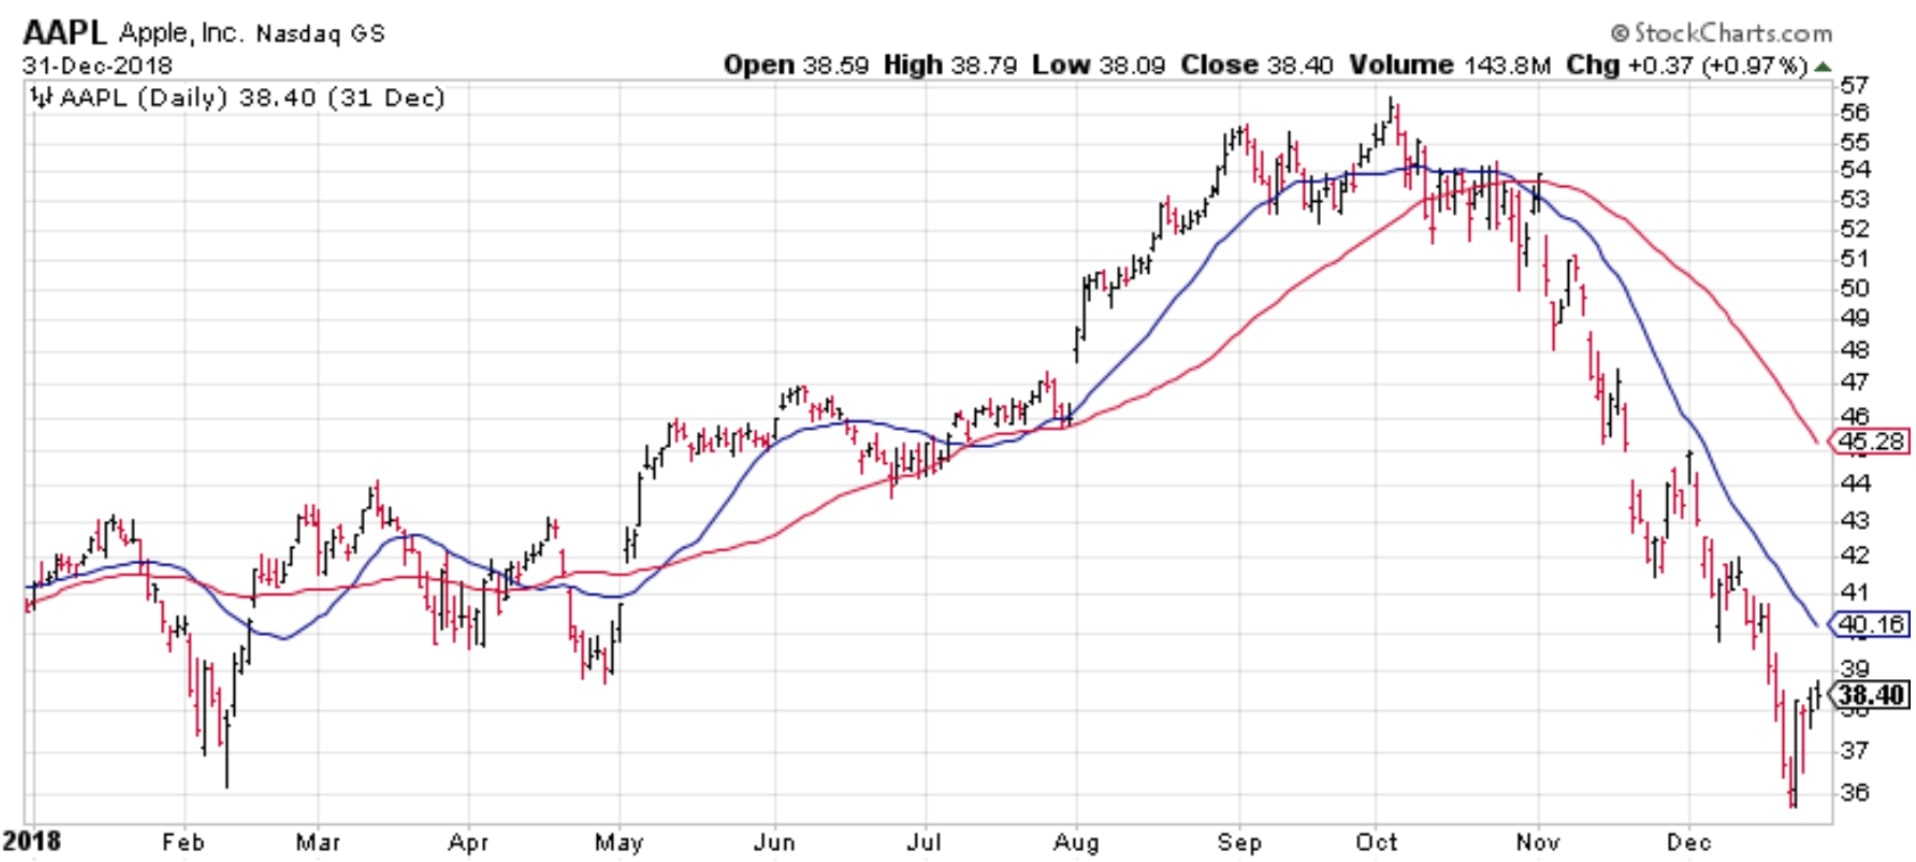
We’ll now zoom in to 2018 to look at a shorter time period.
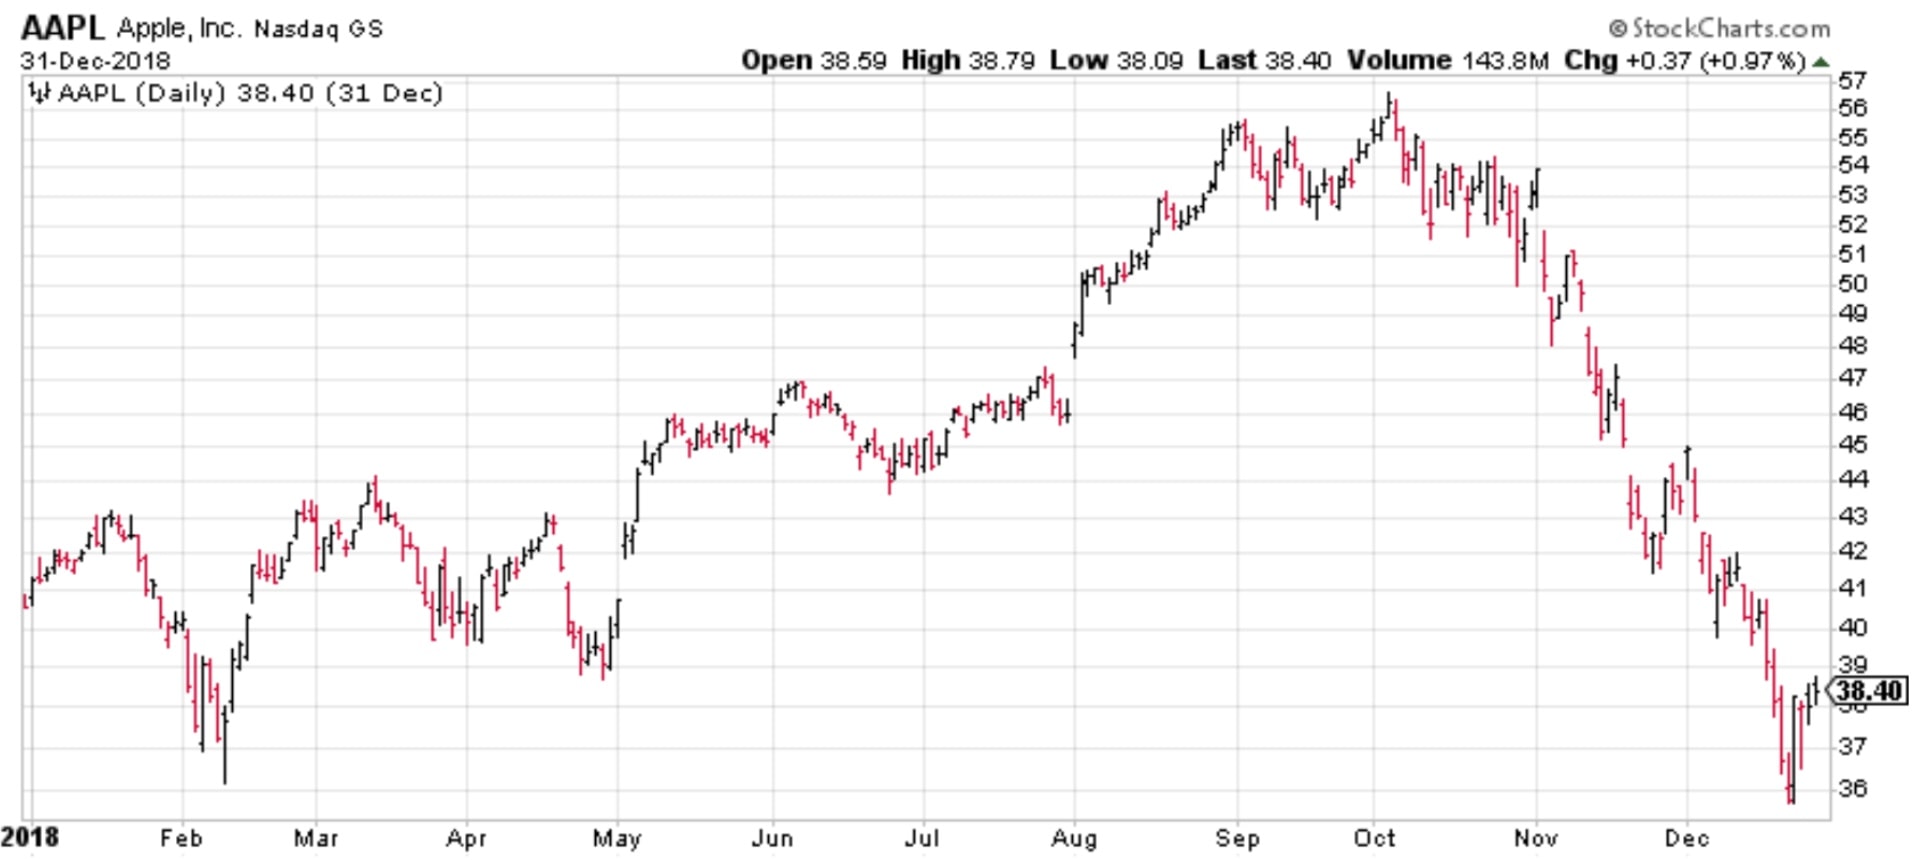
Stocks don’t always go up. Apple’s stock fell -5% in the 12-month period of 2018. These zig-zags provide trading opportunities. A trader’s aim is to beat buy-and-hold return while managing risks. There are tons of indicators traders use in technical analysis. I suggest not to use too many indicators and to pay most attention to price. Indicators often seem like something magical but are actually derivatives of price and don’t have predictive power that many seek for. Let’s try to add some simple but useful indicators to work on a trading edge to time price action.
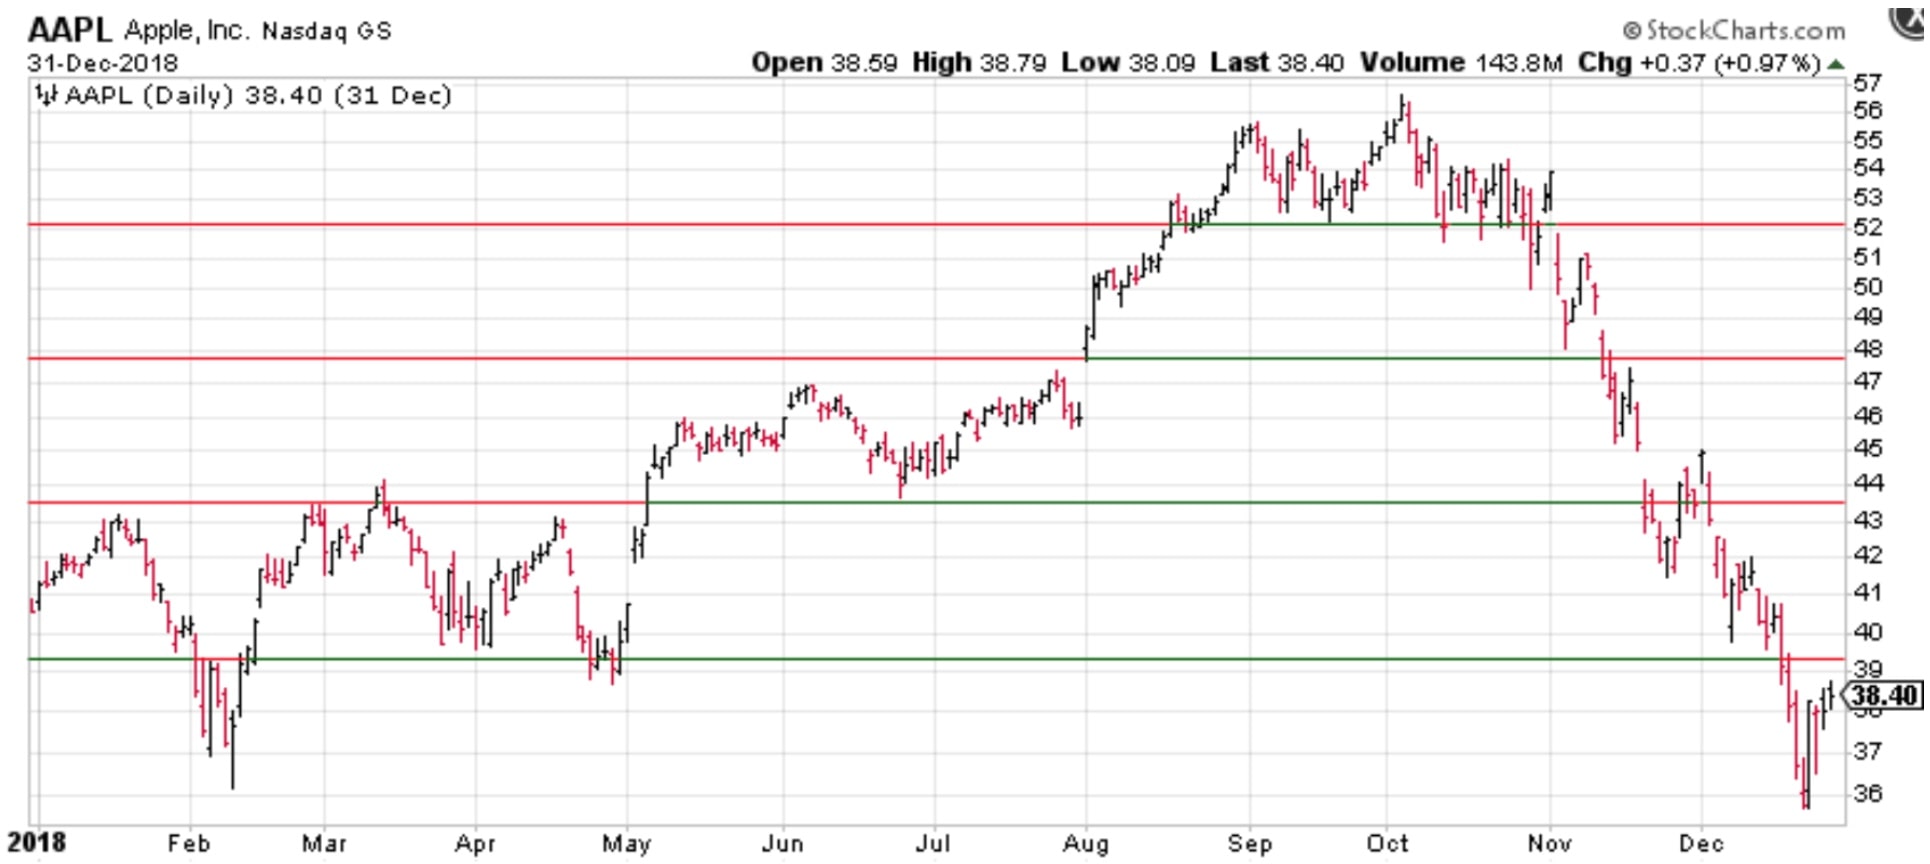
One of the most reliable ways of technical analysis is classical chart reading of horizontal support and resistance levels. Support is where buyers often step in and start accumulating the stock which puts floor under the price. Resistance is where sellers become motivated to unload their stock positions. This creates areas where stock price tends to reverse more often than not. Support and resistance levels are not magical lines where price must do something. These are probable areas of change in supply and demand. When price breaks above resistance, it often becomes support. When price breaks down of support, it often becomes resistance. Traders use these levels for price reversal or breakout to a new level. The lines are drawn on historical data points which makes it subjective in nature, but one needs screen time (experience) to determine the areas more accurately.
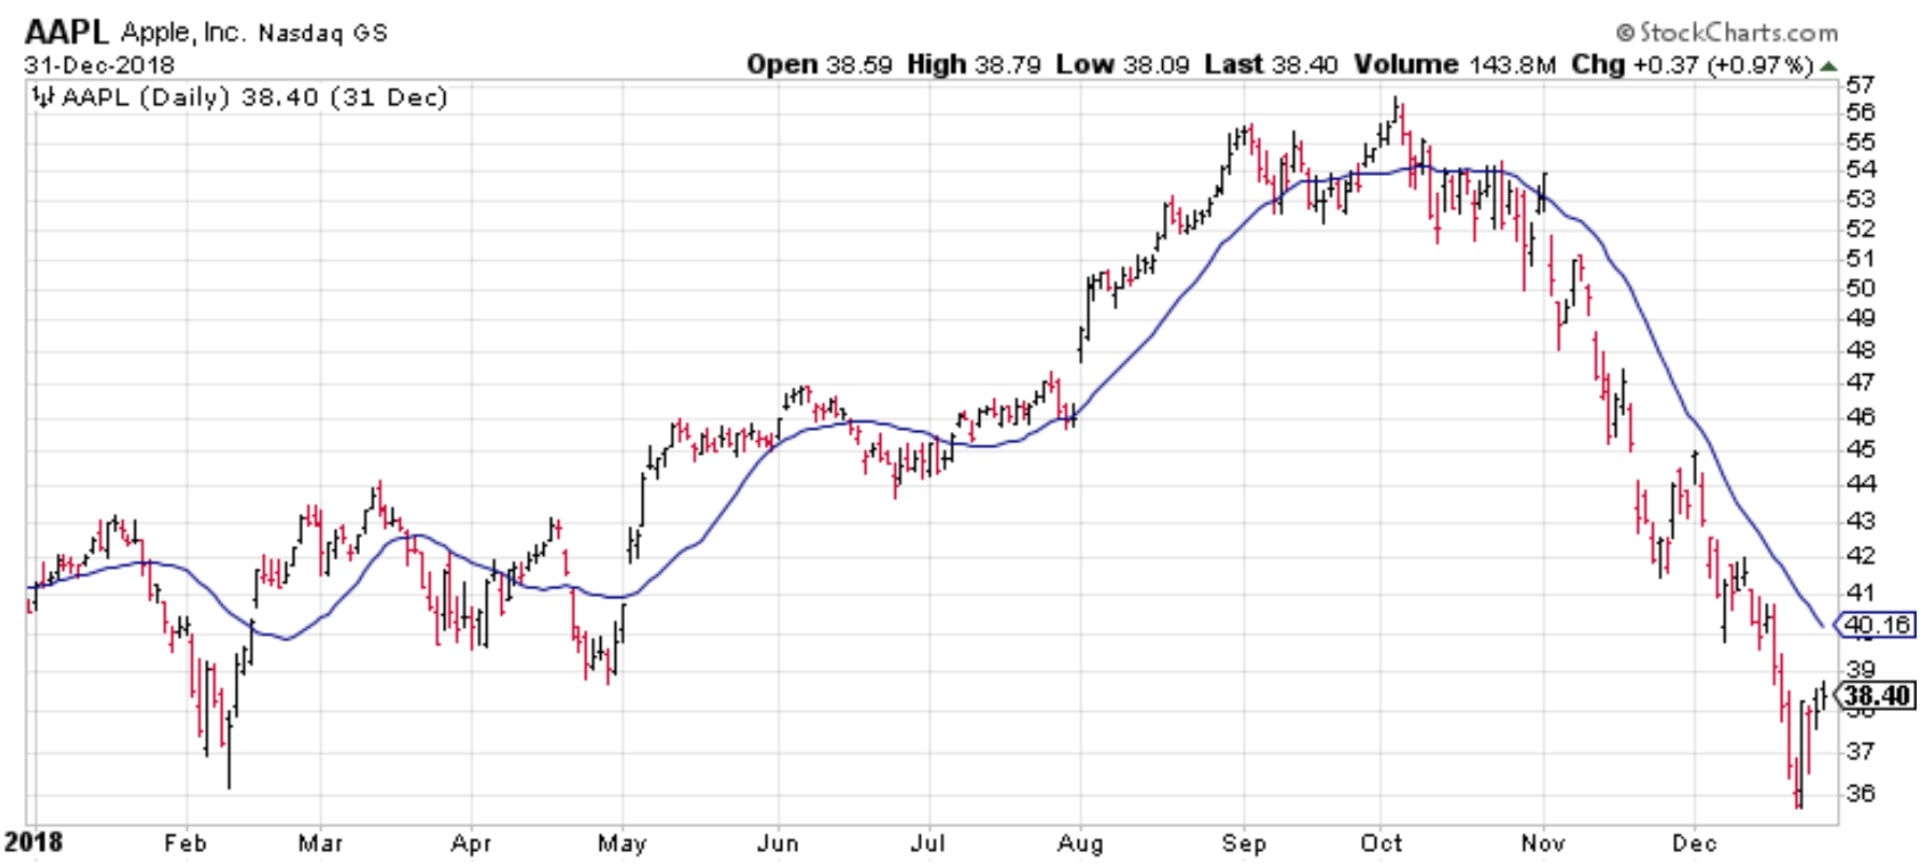
Another good tool in technical analysis is moving average. Price oscillates around the average which is its technical value zone. Here you can see the same Apple chart with 20-day simple moving average. It calculates closing prices of the past 20 days and averages them to the blue line. When the MA line rises the trend is up, and when the MA line falls the trend is down. Another way of looking at it is to see, whether price is above the MA line meaning it’s rising, or price is below the MA line meaning it’s falling. When price is stretched far above the line it’s technically overvalued and when price is stretched far below the line it’s undervalued. As you can see, it’s not a magical line and needs to be taken with probability not certainty. You can test different lengths for moving average, most use 20, 50 or 200-day MA. Some use more than one MA and some use EMA (exponential moving average) which takes more into account the most recent price data and not all equally like the simple one. It makes EMA react faster at the right edge of the chart. Also, the shorter the MA length, the faster it turns. Longer period MAs are slower to react. It’s about the balance between whipsaw vs lag. Shorter (fast) MAs give more signals but also more false ones (whipsaw); longer (slow) MAs give less signals but have more lag, meaning you’ll get in and out more slowly. Therefore, a trader needs to find balance to use a moving average with optimal length to get enough signals but not be thrown around by false ones frequently. Compared to the subjective nature of support and resistance lines, moving averages are objective indicators because they are calculated on a concrete math formula.
Some traders use two or more moving averages. Here you can see a chart with 20-day and 50-day moving averages. In uptrends, the shorter MA is above the longer one, and in downtrends the shorter MA is below the longer one. This is because the shorter MA is faster to react to new price data while the longer MA takes more time to react. When trading moving average crossovers, one needs to test and try different MA periods and timeframes. In trading ranges and pullbacks this method can cause frequent whipsaws (false signals to get in and out). It needs some flexible rules or combination with another indicator.
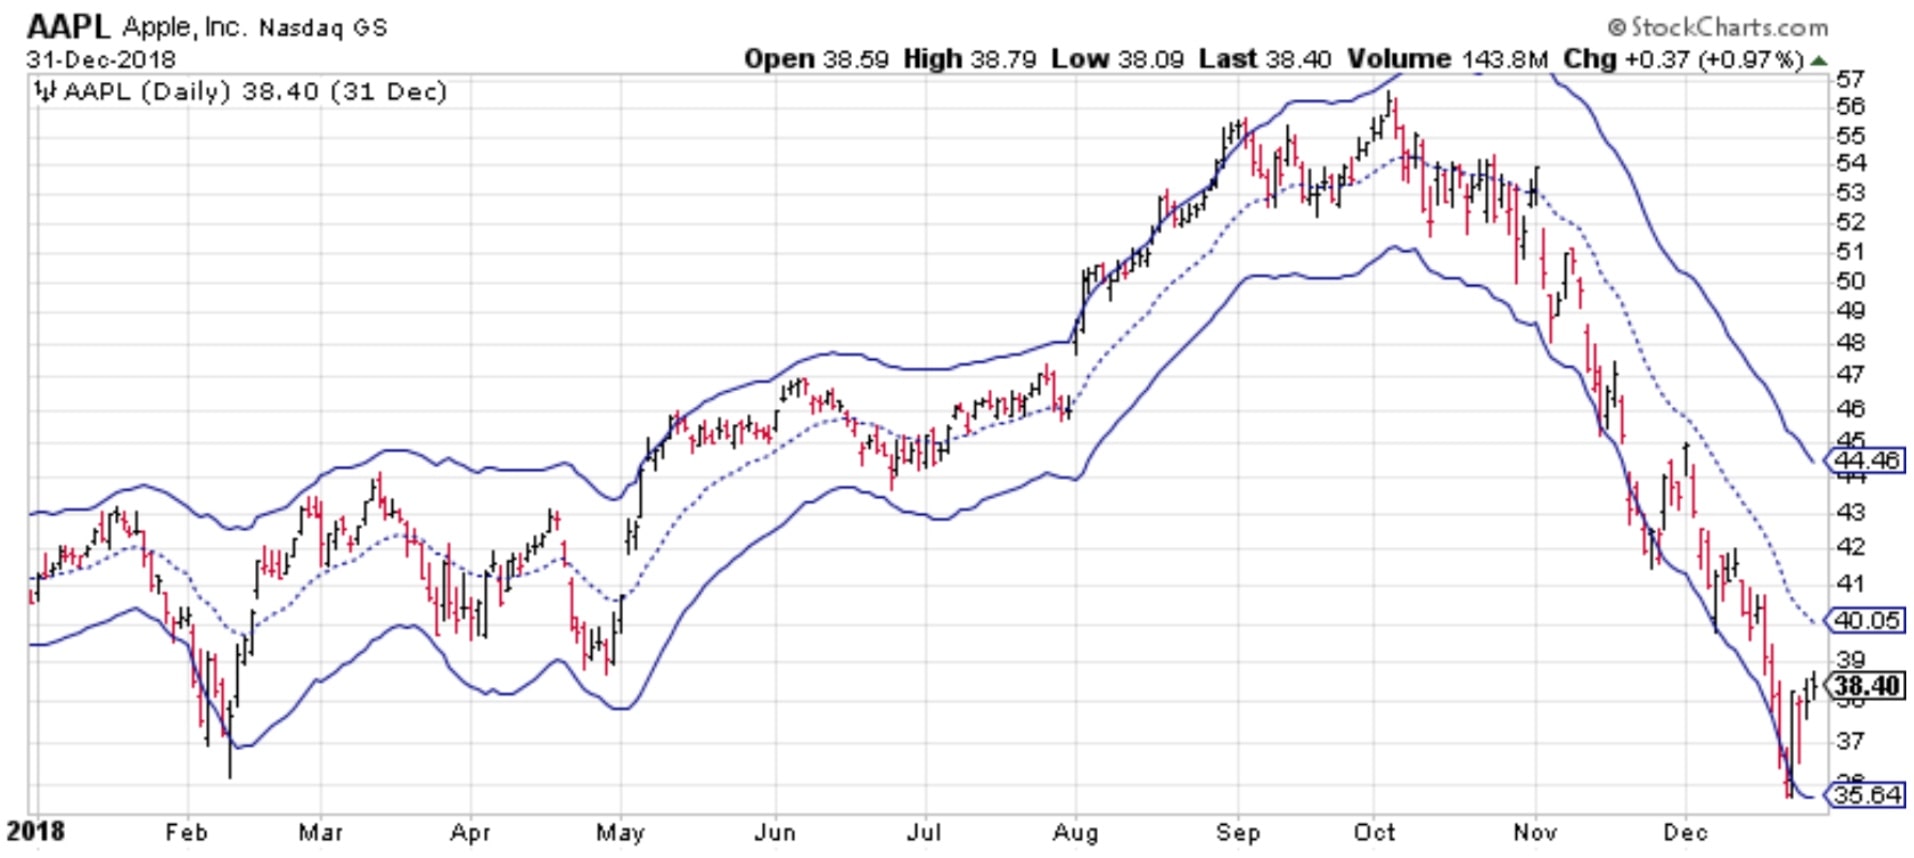
Another tool I’d like to show is Keltner channel. It draws an exponential moving average (dotted line), 20-day EMA in this case with two channel lines that take volatility (average true range) into account. The upper and bottom channel lines show deviation from the mean, in this case 3 times ATR from the EMA. In sideways trading ranges, the upper channel line marks an overbought area where the price tends to pull back and the bottom channel line marks an oversold area where price often snaps back towards EMA. However, when price starts to trend it may stay around the channel line for some time. In a trending environment, price stays most of the time between the EMA and upper channel line in uptrends, and between the EMA and lower channel line in downtrends. Like with all technical indicators, it must be taken with some flexibility as these lines are not rigid places where the price must do something. Looking at it from the bigger picture perspective, price tends to oscillate up and down in the channel, creating probabilities and trading opportunities. There are many other channels like Envelope that is a fixed % deviation from the mean and doesn’t take the change of volatility into account. You should set the fixed % deviation so that 95% of the price action is inside the channel, then it’s a more reliable tool for overbought and oversold areas. Another popular tool of channels is Bollinger Bands which takes volatility into account and is often used by options traders.
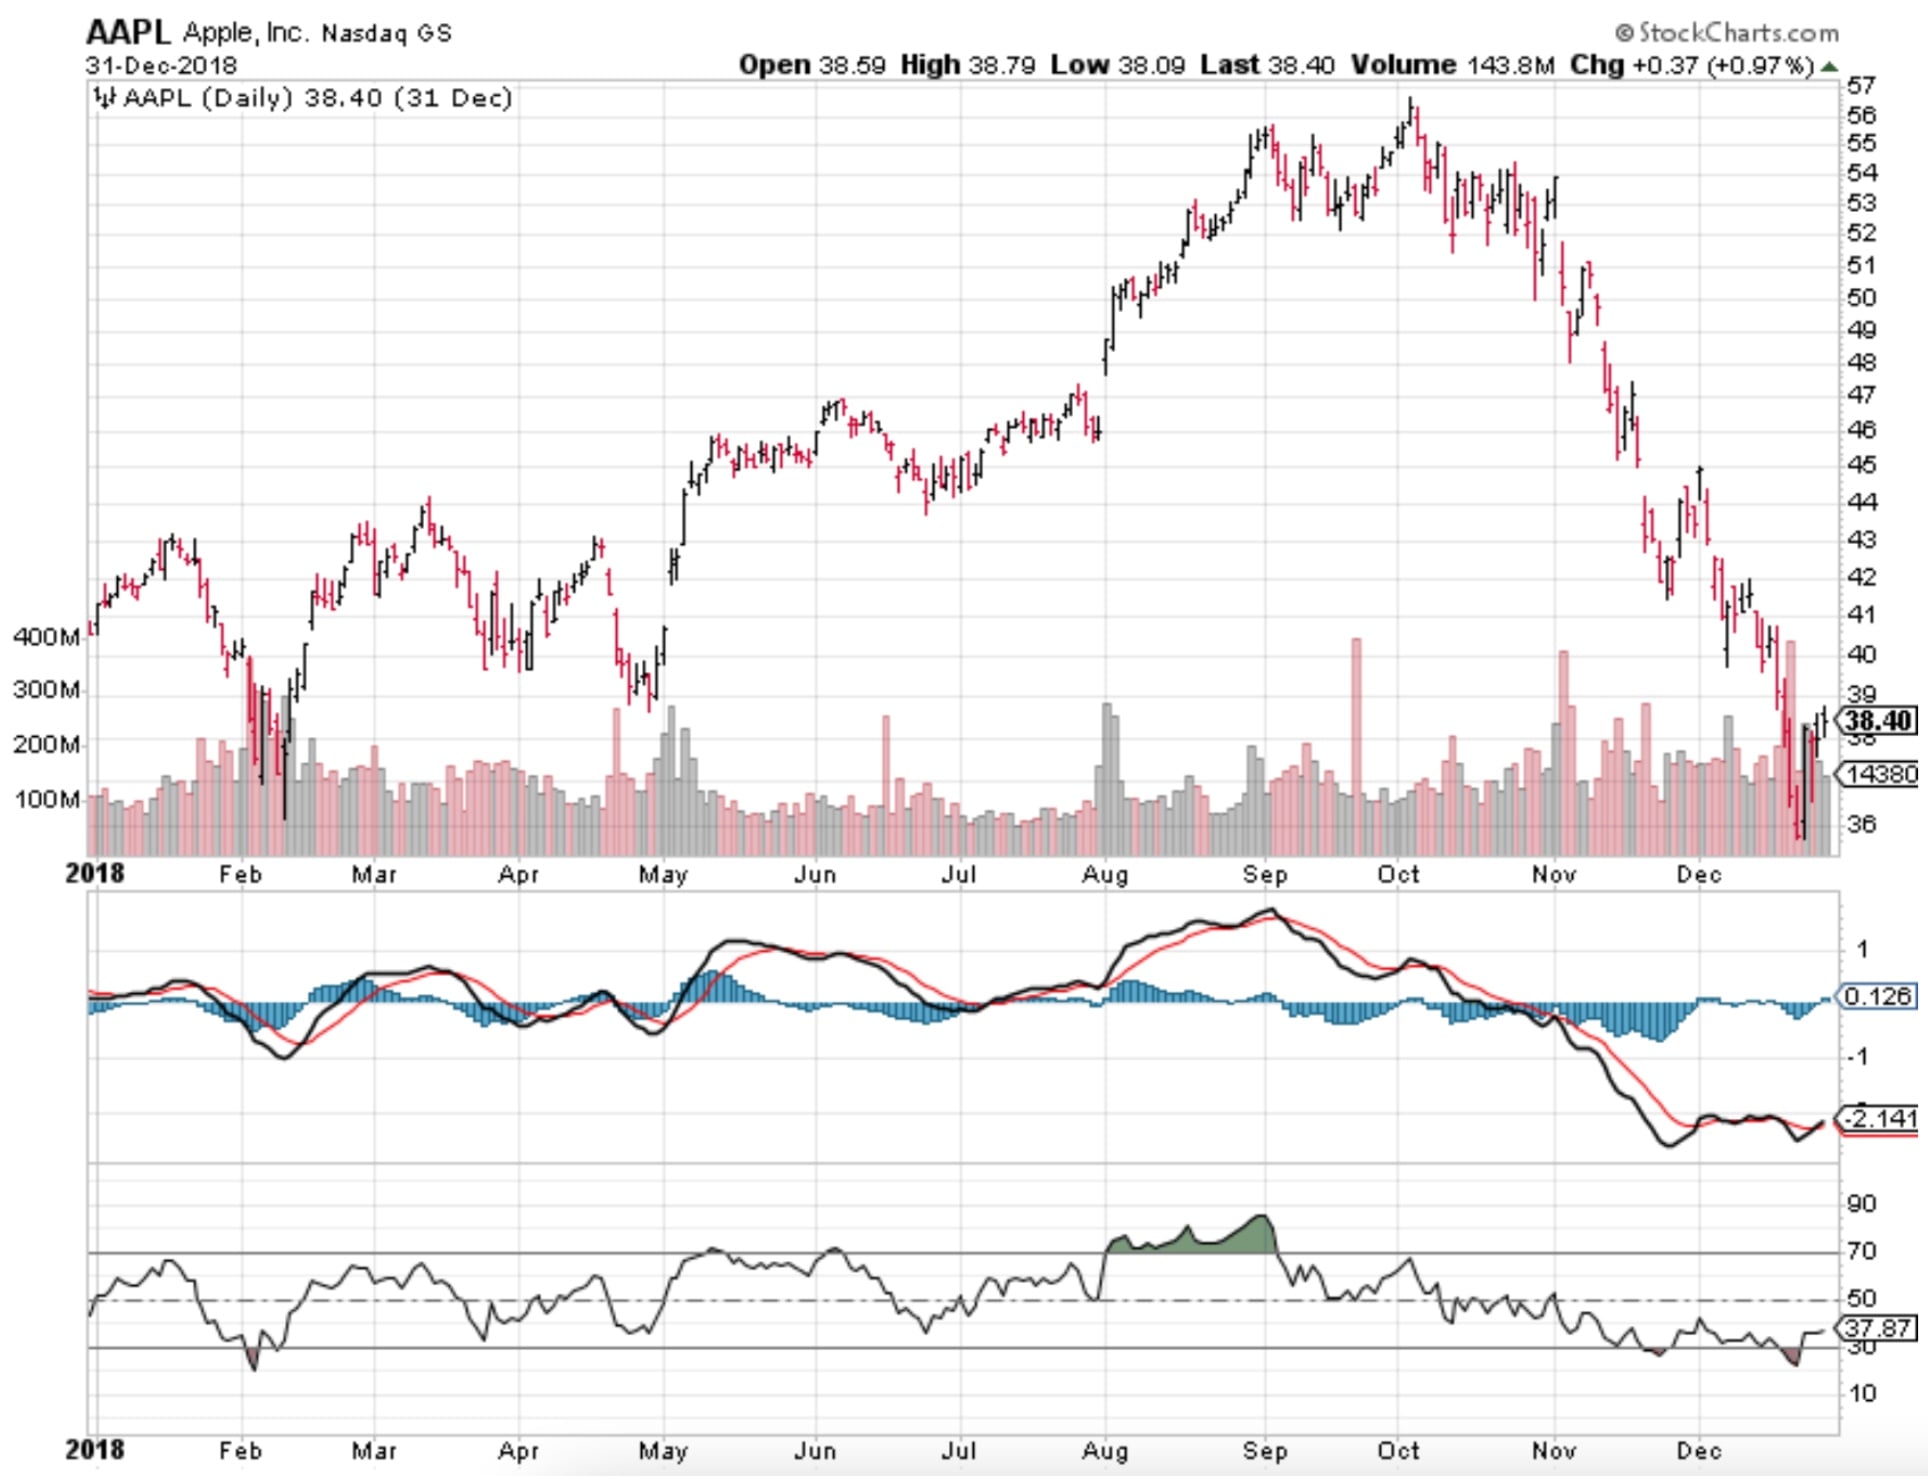
Here is a chart with some additional indicators that are not just overlayed to price data, but added as separate windows. First, there’s price data with volume bars.
The second window has a blue histogram that is MACD with default settings (12,26,9). The black line is a combination of moving averages and the red line is the black’s value smoothed with another moving average. The height of the blue histogram shows the spread between the two lines and when the black one crosses above the red line, then histogram goes positive, if the black line crosses below the red one, then histogram goes negative. It is a momentum indicator. When the histogram is positive it shows upside momentum and when it’s negative, then it shows downside momentum. The black line crossing above the red one is bullish, and the black one crossing below the red line is bearish. I personally use this indicator only to trade divergences which is a mean reversion setup. It’s basically a situation where price extreme is not confirmed by the indicator, signalling a possible reversion to the mean. There is some divergence on this chart where price makes a higher high in October but the MACD histogram and lines are lower compared to the previous price high in September. Regarding divergences, same applies the other way round to bottoms.
Below MACD there is RSI indicator with default setting of 14. It signals overbought level above 70 and oversold level below 30. The overbought condition may last for a while in trending markets as can be seen how RSI was overbought the whole month of August while price was going higher. Same applies to the oversold level in downtrends which may last for a while. Trend traders often use it as such that RSI above 50 is uptrend and RSI below 50 is downtrend. I personally use it also only for divergences. As you can see, the same September – October double top bearish divergence is in RSI and much stronger than in MACD. In September, RSI was clearly overbought reaching 90 but in October when price was making a higher high, RSI couldn’t even reach the overbought level of 70. RSI signalled that the top was exhausted and ready for a possible reversion to the mean. It’s important to note that the bearish divergence does not always result in a trend change like it happened on this chart. Usually it’s a pullback trade and such heavy downtrend is less likely to follow.
Odds and probabilities
Let’s think about odds in trading. Every trading style has its own characteristics of win and loss distribution. Trend traders may get only 30-40% right meaning they have more losing trades than winners. They don’t pay attention to the win rate as much as to average win / loss ratio. The low win rate is compensated by big winners when they do get on a trend, and it usually means their average winner is at least 3 times bigger than the average loser. Swing traders who mostly trade mean reversion have a higher win rate of 50-60% so they win more often than lose. But it comes with taking profits earlier and therefore having average win about 2 times the size of the average loss. It’s about math, you just can’t have the best of both ends. It’s either taking many small losses to get bigger winners, or realizing smaller winners quicker to be right more often.
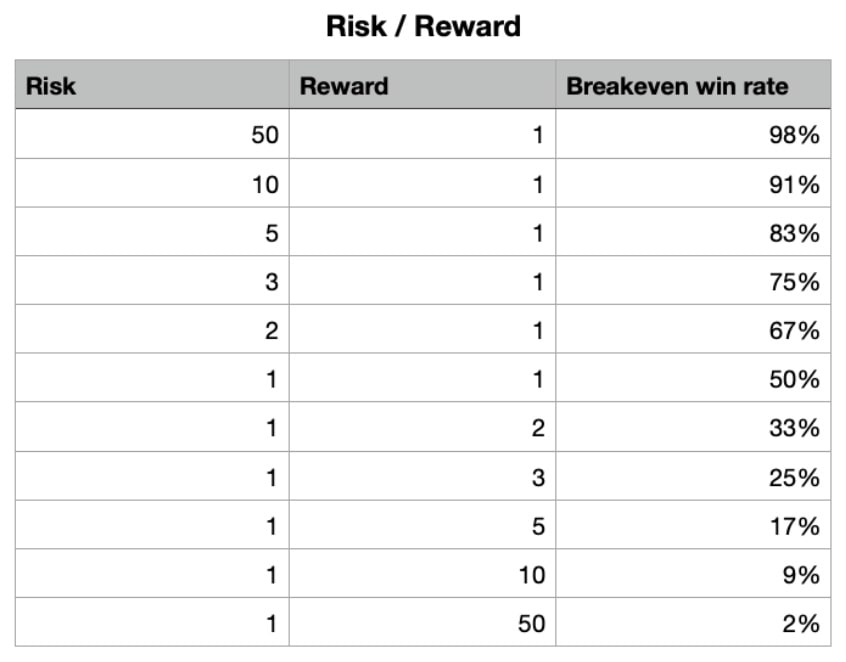
The table above shows the breakeven win rate for different risk / reward combinations. So above that win rate %, the particular risk / reward ratio becomes profitable. In my experience, you want to aim risk / reward ratio of 1:2 or better, meaning your wins are bigger than losses. The lower you let your win rate, the more rewarding trades you can aim for and vice versa. For example, a trend trader with a risk / reward ratio of 1:3 needs over 25% win rate to be profitable. A swing trader with 50% win rate needs to have better than 1:1 risk / reward ratio to be profitable.
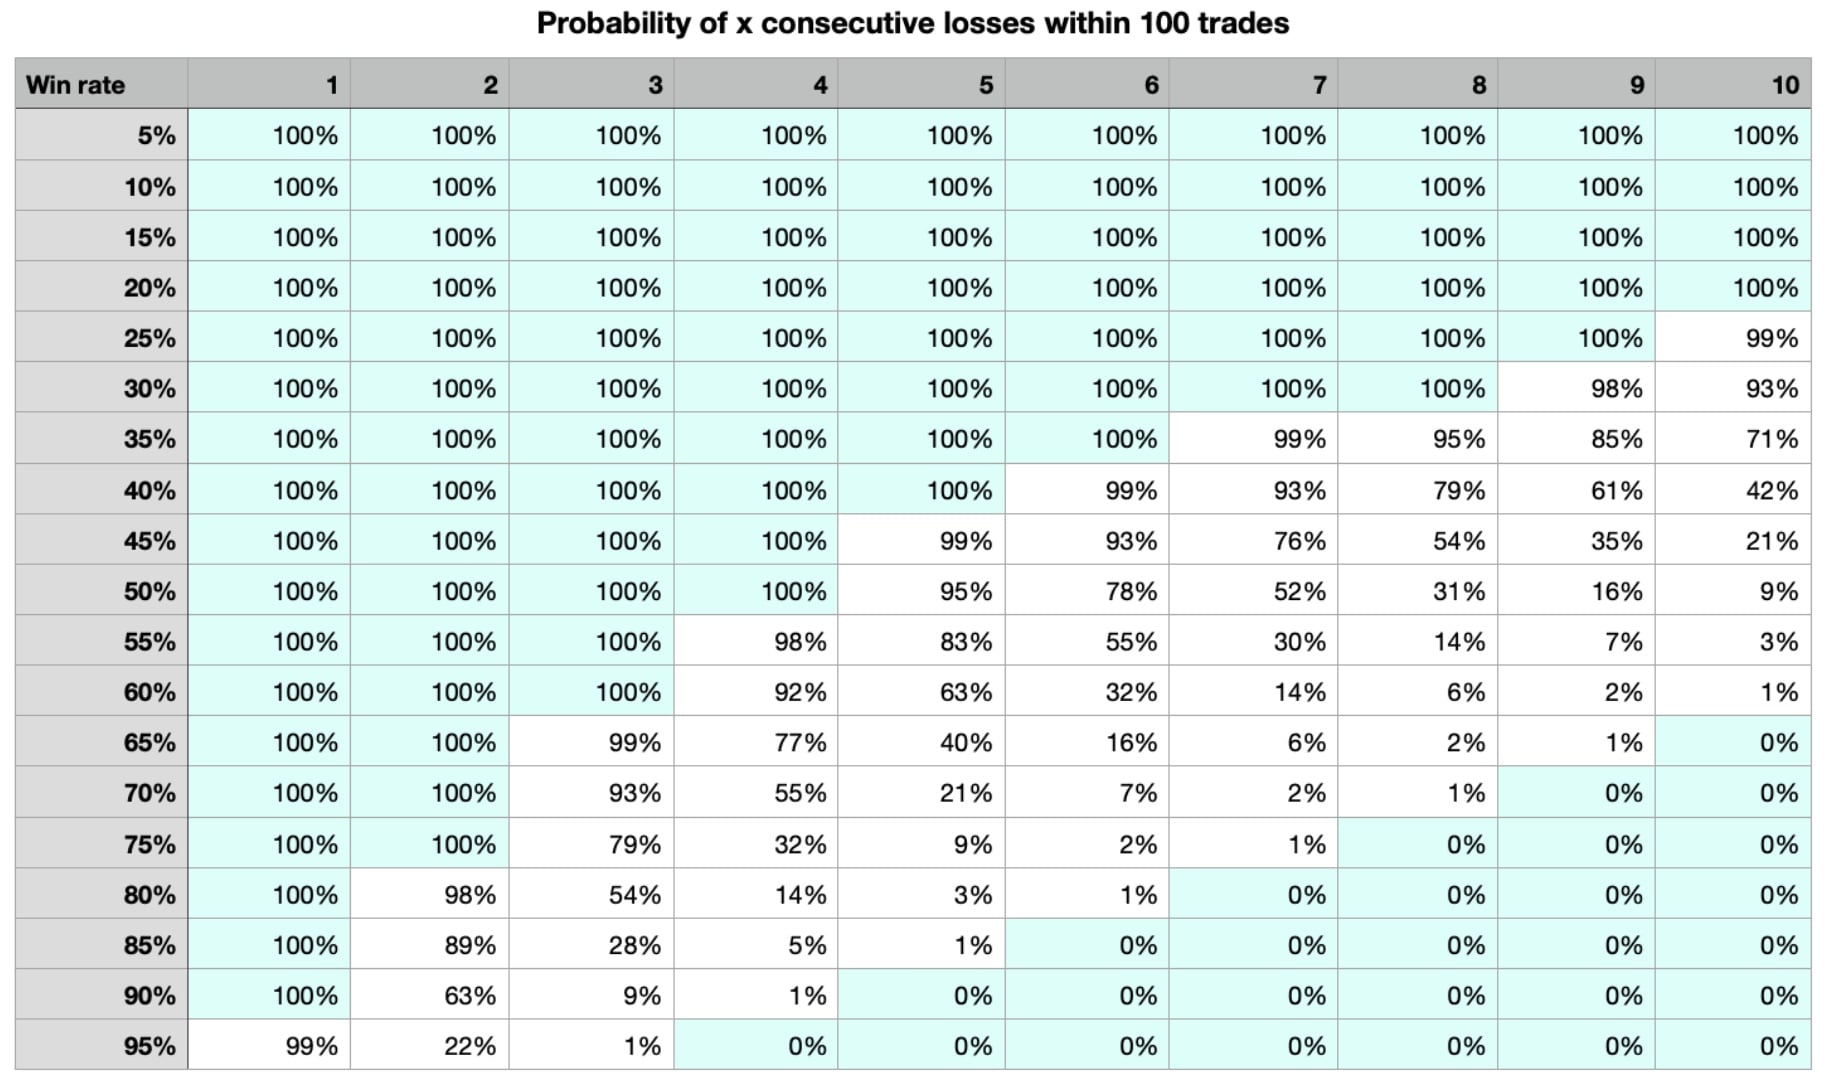
The table above shows the probability of consecutive losses within 100 trades by win rate. From risk management perspective, there’s a 42-93% probability that a trend trader with a win rate of 30-40% will experience 10 consecutive losses. A swing trader who takes smaller profits with a win rate of 50-60%, will have 1-9% probability for a losing streak of 10 losses. While it seems to favor swing trading, remember that trend traders have bigger winners on average. Both styles have their pros and cons. The main message from this table is to have strict stop placement and position sizing rules in place. Otherwise a trader will face the risk of ruin, meaning he or she loses all capital and is not able to trade anymore. Imagine having 50% win rate (a coin flip) and risking 25% of capital on a single trade, you are sure to go bankrupt in a matter of time.
STYLES OF TRADING
Trend trading vs mean reversion
Swing trading makes more sense to most people, because it’s a mean reversion style, you try to buy low and sell high. It’s about buying weakness and selling into strength. However, a trend trader wants to have confirmation that a possible trend has started so the low can’t be bought while price is still trending lower. This is why a trend trader buys strength and sells into weakness when the uptrend starts to bend. In other words, a trend trader buys high to sell higher. For shorts, a trend trader sells low to cover lower. Of course, taking small losses along the way when the anticipated start of a trend doesn’t materialize. This is why a trader always needs to know where he or she gets out if the trade doesn’t work, before getting into the trade. Also, one needs to write down the level or rule for a profit target. Trend traders often use a trailing stop, so it’s a protective stop and a price target two in one. You ride the trend until the stop takes you out.
I’m personally trading both, trend and swing strategies to have diversification in my portfolio. When markets are trending, my mean reversion setups don’t occur that often but when markets go sideways and trend strategies are taking small losses, then mean reversion setups kick in to make money. It’s not about being right, it’s about making money in probabilities. I’m not looking for the holy grail that never loses money, I’m fine with taking small losses and keeping my trading open to bigger winners. One word of caution is not to manipulate the average win / loss ratio with stop placement when putting on a trade. You should always put the stop where it makes sense for the setup and see if the ratio of stop / target is something you’d trade, not the other way round. If the risk / reward ratio is not appealing, scratch it and move on to the next setup.
Momentum
Momentum is price persistence, meaning one expects a strong price move to continue in the same direction for some additional time. Basically, it’s like a short-term trend and though I mostly apply same principles to momentum that I use for trend trading, I take at least some profit off into strength with momentum trades and sometimes trail the rest with a trend following method. Stops and profit targets can be channels, moving averages, % moves, price patterns etc. In my experience, it’s more important that you choose your tools and stick to them, and not go around picking different tools while in a trade. No tool works wonders, but consistently using a tool in a disciplined manner can put the odds in your favor.
Technical trading
Beginning traders want to put all kinds of lines and indicators on a chart like trend lines, several MAs, RSI, MACD, Stochastics etc. It comes from the urge to collect more data to create a false sense of being right. You should do the other way round. Take a clean price chart with no indicators and try them one by one, no more than 5 indicators at a time if you actually need them to make decisions. Indicators do not show you the future, they are always showing the past not the future! Don’t be misguided by that. A great indicator or pattern is usually seen in hindsight, you just don’t notice the times it didn’t work cause they don’t show up on charts in such case. Less adjustable parameters and filters make a trading system more robust to work and make money going forward. Technical analysis often gets beaten up for not predicting the future right, but it’s those people who have gotten it wrong. Technical analysis was never meant to predict the future! The chart is for measuring a statistical edge, being able to manage risk, apply entry and exit techniques to put odds in your favor. It doesn’t mean you’ll win every time. The result of a single trade is random. You need to look at a bigger sample of trades. Think of the next 100 trades you put on. Let go of the predictive mindset! Think in terms of risk / reward and trade frequency. Market moves are random most of the time and anything can happen!
Discretionary vs systematic
Broadly speaking, there are two basic styles to approach financial markets – discretionary and systematic. Discretionary trading is a situation based way to trade the markets where the trader can use his or her experience, intuition and opinion to make subjective decisions on the go. Though there’s discretion involved, a discretionary trader can still have rules, for example on how to size positions, place stops, take profits etc. But the trade management relies more on the trader than rules. On the other hand, systematic trading uses strategies with fixed rules to eliminate all opinions and intuition of the trader, being therefore more objective. While a trader uses discretion to develop a systematic strategy, once it’s put to work, it gets no input from the trader, everything runs systematically. Though systematic trading eliminates emotions from the daily process, it’s still difficult to stomach drawdowns when the system trader can’t be sure if it’s an expected setback or the start of system’s degradation. Discretionary traders have control over decision-making while systematic traders must obey their set of rules. Usually, discretionary traders can have better short-term results while systematic traders tend to have lower but more consistent performance over the long-term. I am personally a systematic trader but I started out as a discretionary trader. I think this is the case for most people because when starting out you don’t know much and try different things without any set of rules. As time goes by, one experiences and learns more to understand better which way to go. I’m not saying systematic trading is a better choice, I like it more maybe because of my IT background. It’s definitely not easier than discretionary trading as trading systems degrade and die, so it’s also a consistent process of work to research and backtest new ideas. But either way one wants to go, learning the markets as a discretionary trader is a good start. Systematic traders automate the same trading techinques with rules that discretionary traders apply. So in order to understand what to put into a system, one needs to first study the markets. Paper trading and manual backtesting on charts can be a beneficial excercise to study technical analysis. It excludes emotions that you feel when putting money at risk, but it’s still a good way to understand what to look for on charts, how to measure risk / reward and calculate position size.
BECOMING A TRADER
Why consistency matters

I have shown you some tools of technical analysis but there are many more. It’s not about finding the best tool, it’s about finding the appropriate one to support your trading style. Beginning traders often think the success lies in one or another indicator but actually it’s much more important how one uses an indicator and if it gives any edge in trading. I suggest to pick a few tools that feel convenient, test and try them and stick to it. Consistent trading results come from the consistency in your process.
I’m trying to give ideas here but not showing any exact trading strategies. Why? No strategy is good to trade right off a book or a blog. A trader needs to test and understand why a strategy makes money, otherwise he or she will not stick to it when the inevitable time of poor performance occurs. Yes, every trading strategy has better and worse times of performance and that’s why I diversify my strategy portfolio. Also, strategies come and go, meaning the more market participants start to trade the same strategy, the sooner it dies because the edge will get saturated. That’s why traders don’t reveal their edge and exact strategies to everyone through public channels. So it’s better not to copy what others do but try to understand their mindset and thinking behind the action. Consistency and habits needed to become successful in trading will be possible by living through the strategies you develop. It’s not just about research and testing, you need to experience it with real money over time to achieve mastery.
Longevity is the key
Trading may feel stressful and impossible at first but once you get over the hump to the other side and realize what you need to do to succeed, trading can become an enjoyable process. It’s in beginning traders’ mind that keeps them apart from success. Most start out wanting to be right and make consistent money but this is not what established traders do. Many professional traders are wrong more often than right but they cut their losses and let winners become so large that they pay for losses and more. This is how profit is made in the markets. And because markets don’t move in a consistent manner, they can’t provide you steady income. There will be times your strategies are in sync with the market and you need to maximize the potential, then other times occur when markets react different to your expectations and you need to cut back risk to survive til the better days are back. Remember, process over outcome! You need to manage risk and limit losses and the winners take care of themselves. If you pay attention to losers and have discipline to stick to your trading plan, then profits will be the inevitable result to the good process.
You need to build habits to have a good process which is essential for successful trading and longevity in the markets. You can get help from mentors, books and courses but in the end it’s up to you if your trading activity will be profitable. Order execution is not what makes money, having exposure in price moves is the source of trading profits. Most beginning traders are impatient and don’t understand that this is actually a game of patience. Technology has made the playing field more equal and retail traders have never had better time to trade against institutions. However, the biggest hurdle for any market participant is human nature that hasn’t changed over time.
Top 10 mistakes traders make
- Look for answers in the media and listen to others’ opinions.
- Think that traders need to be trading all the time and check prices tick by tick.
- Trade without a plan of entry, exit and position sizing rules.
- Trade without a stop loss.
- Add to losing trades.
- Trade too big.
- Exit winning trades too early.
- Make emotional decisions based on profit and loss figures.
- Jump from one timeframe to another to find comfort for an opinion.
- Keep looking for the best trading method to avoid losses.
How to learn more from me

Hopefully this page has been helpful if you’re still reading. I’ve been occasionally asked for personal mentoring. I know how difficult it is to start trading alone. I’m at a place with my own trading where I have automated most of the work. It takes me less than an hour daily to follow my plan and place orders. I’m open to mentorship inquiries. If you need assistance with strategy development, technical analysis, risk management, mindset and psychology or organizing trading tasks, then I may be able to help. I am not a financial advisor and this is not investment advice.
Such personal mentoring has its cost and is not suitable for everyone. I charge $175 per hour, terms apply. I use Google Meet and Microsoft Teams but can switch to a more convenient platform for you. I speak English and Estonian.
If you are serious about trading and want to learn from my experience, then please fill in the contact form and I will get back to you with details: Contact