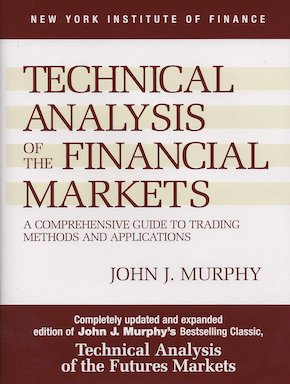
 Probably a must read if you want to understand technical analysis, all the chart patterns, different indicators, charting etc. – this book is all about this.. and more.
John Murphy is a highly experienced technician in financial markets, he has published several books about this. Somehow I got to this title and understood at once I needed to read it thru. I’ve been enjoying the summer with trading and reading.
I am using Stockcharts.com for charting and Murphy keeps a blog there that is for members only. Highly valuable insights!
There’s really too much content in this book to get in-depth, but everything possibly about charts, indicators, volume, timeframes… you name it. There’s actually too much information to consume, so I think this book should be read over several weeks rather than all day long. Some of the stuff I went thru quicker that I realized I won’t be using all the indicators.
As I have learned from Elder, you should have 3-4 indicators on your chart and if you have more than 5 you are in trouble. The point is, all indicators use same variables: high, low, open, close, volume. So you don’t really need confirmation of confirmation of confirmation… the indicators will overlap.
While I don’t day-trade, I’m still more a short-term trader, holding positions overnight but usually for a few days up to a week. John Murphy’s work is more long-term and charts go back in years and even decades. It’s still helpful to learn basic and classical charting which you can apply to shorter timeframes.
Topics this book gets into: Dow theory, trends, reversals, continuation patterns, volume and open interest, moving averages, oscillators, contrary opinion, point and figure charting, candlesticks, Elliot Wave theory, time cycles, computers and trading systems, money management, trading tactics, futures, stock indicators, market profiles and a lot more.
Technical Analysis of the Financial Markets by John J. Murphy book link
Share this post