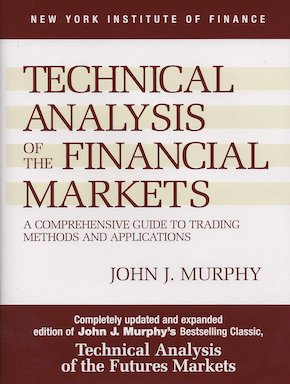
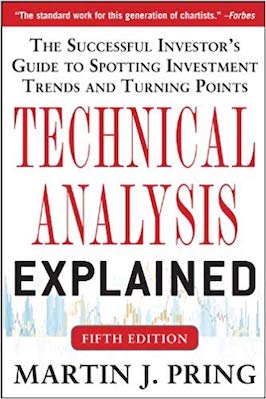
Similar to John Murphy’s book about technical analysis, Martin Pring also does a good job on teaching the most classical charting practices, patterns and indicators.
Topics discussed in this book are: trend tools and techniques, market structure, different types of technical analysis, seasonality, cycles etc.
Martin Pring is also a contributor to Stockcharts.com blog where I read his market updates available only to registered members. His work on charts is longer term dating back in years and even decades. So even if my own work is more shorter term oriented, it’s interesting to look at the bigger picture understanding what’s the trend of the secular market, what the longer-term correlations are between different markets like bonds, commodities, forex and stocks; etc.
He has developed a momentum oscillator KST (Know Sure Thing). It is a smoothed version of the “Rate of Change”, but to me already the name of it sounds weird. There are no sure things in trading and to name an indicator like that makes it look like a crystal ball. 🙂
What is the KST (Know Sure Thing) indicator?
KST is Pring’s momentum oscillator, and it is easier to understand once you see the parts. It takes the rate of change over four different lookbacks, smooths each one, and adds them up with more weight on the slower ones. The standard daily settings, as StockCharts documents them, are:
- 10-day simple moving average of the 10-day rate of change, weight 1
- 10-day simple moving average of the 15-day rate of change, weight 2
- 10-day simple moving average of the 20-day rate of change, weight 3
- 15-day simple moving average of the 30-day rate of change, weight 4
KST is the weighted sum of the four, and a 9-day simple moving average of KST is the signal line. There are slower versions for weekly and monthly charts. The basic reading: momentum favors the bulls while KST is above zero and the bears while it is below, and traders watch zero-line crosses, signal-line crosses and divergences.
My view hasn’t changed since I wrote this review: the name promises more than any indicator can deliver. But the idea behind it is sound. Mixing four timeframes smooths out a lot of the noise a single rate of change has, which makes it a reasonable trend filter on a weekly or monthly chart. It is still a lagging measure of past prices, so it tells you what momentum has been, not what it will be. If you want to see what happens when a classic momentum signal is actually tested, look at the RSI divergence study I ran on 20 years of S&P 500 data.
How big is the fifth edition?
The book has been through five editions, and the fifth, from 2014, runs to 797 pages. That tells you it is a reference book more than a cover-to-cover read. Like Murphy’s book, it is the kind you keep on the desk and open when a chart shows you something you don’t recognize.
Learning the basics of technical analysis is useful even if you’re not going to manually work with charts or want to become a quant trader and program your tools, cause it pays to know how the market moves regardless of your trading style and timeframes.
Affiliate link: as an Amazon Associate I earn from qualifying purchases. It doesn’t change the verdict.