The optimistic US stock market at all-time-highs has started to concern many and I’ve been asked how one should prepare for the possible downturn. There is no single indicator nor holy grail to let us know about a bull or bear market, but I’ve found price to be the most reliable indicator when it comes to market timing.
I’ve been playing with quantitative analysis in AmiBroker and want to share a simple monthly strategy that needs very little maintenance to beat the S&P 500 index with market timing. Let me first start with the results of the past 21 years.
Some would ask why 21 years of data. Sure, the results will differ if you look back 50 or 100 years. I want to use the latest data for out-of-sample analysis so that putting a strategy live today makes sense. Markets change and since 2000 there has been a huge shift to electronic markets, algorithmic trading and passive investing. The look-back period, underlying theory and simple approach are robust enough to trust the system for its positive expectancy.
Disclaimer: Past performance is no guarantee of future results. I do not recommend to buy or sell any financial assets. Every financial decision may result in loss of capital. Everyone should do their own due diligence on risks.
S&P 500 Index
1.01.2000 – 12.02.2021
| Buy-and-hold | Market timing | |
| Capital | $10,000 | $10,000 |
| Ending value | $26,800 | $42,167 |
| Trades | 1 | 12 |
| Win rate | N/A | 66,67% (8) |
| Annual return | 4,81% | 7,05% |
| MaxDD | -57% (paper) | -17,26% |
The buy-and-hold made 4,81% annually with maximum drawdown of -57% in the S&P 500 index. Yes, this drawdown is on paper, but do you imagine living through the drawdowns of -50% (2002), -57% (2008), -35% (2020) in real life when your account shrinks by half?!
The market timing strategy I’m about to share, made 7,05% annually in the same 21-years period but the most important part is that maximum drawdown was only -17,26%! The goal of such market timing is to go defensive when a possible bear market hits.
Trading fees are included in data, dividends are not. Yes, buy-and-hold receives dividends during downtrends when market timing is in cash, so the buy-and-hold return would be slightly higher. First, market timing allows to use cash for alternative investments like bonds and gold, so the expected return could be increased with more research. Secondly, do you care about 0,5% quarterly dividend while your account can fall -50% in value?!
Market timing rules
The rules of this market timing strategy are simple and it needs low maintenance once a month.
Buy: end-of-month price closes above 200-day MA, buy MKT on the next open.
Sell: end-of-month price closes below 200-day MA, sell MKT on the next open.
Equity and drawdowns
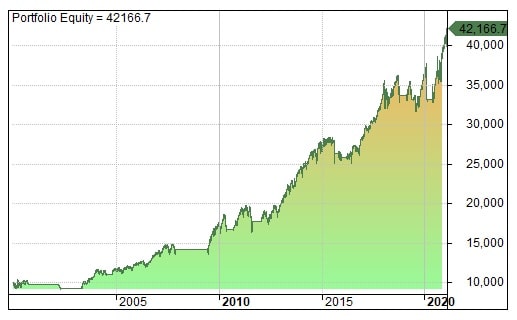
The portfolio equity chart illustrates how the strategy went to cash in 2000, 2008, 2015 and 2020 to preserve capital and survive to invest another day.
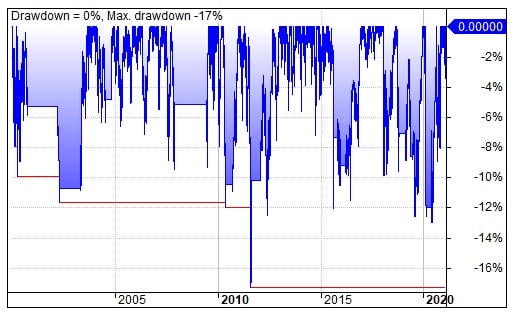
The drawdown chart shows how market timers had maximum drawdown of -17% while buy-and-hold investors had to tolerate -50% (2002), -57% (2008) and -35% (2020) drawdowns.
Profit table and trade list
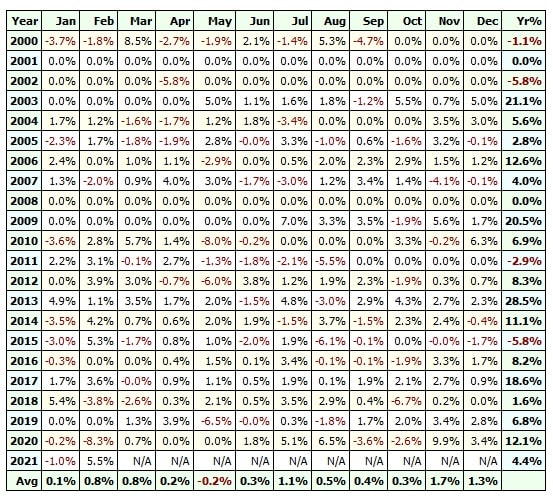
The profit table of the market timing strategy further illustrates the fact that returns are not consistent in the markets, and some months and years can underperform the benchmark. However, in the long run risk adjusted returns have been better compared to buy-and-hold.
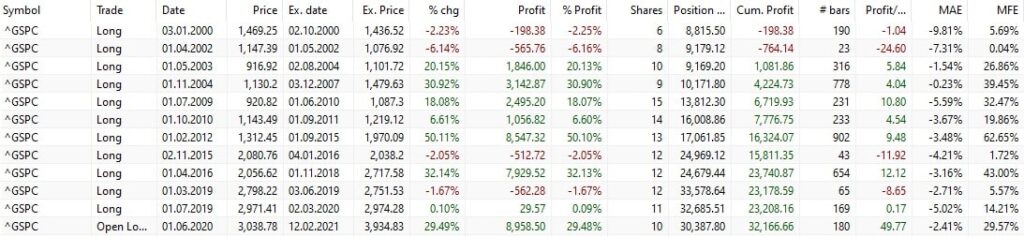
The trade list shows that trades are always executed at the start of a new month (on the next open after monthly price close). Win rate 66,67% means that out of 12 trades 8 were profitable. MAE shows that open loss on paper was always in a single digit.
Conclusion
The point of this exercise is to draw attention to risks involved in the markets. Sure, one could argue about the quarterly dividend not taken into account or different trading fees at brokerage firms but this is not the point. Even if returns were equal, the drawdowns are significantly unlike. Besides preserving capital and allowing it to be used elsewhere, market timing helps to keep emotions in check when panic kicks in.
This kind of market timing is not for everyone. There is occasionally a need to realize losses that is hard for many. Nobody knows how this strategy will perform in the future as the markets are always uncertain and the future unknown. I do not recommend to take any trading strategy out of a blog or a book to blindly start trading it. However, I believe this concept could give aspiring traders and investors some ideas how to preserve capital in the next sustained bear market.
Update: I have published a backtest of the same strategy on the Nasdaq 100 index (QQQ).
Share this post
6 replies on “How to beat the S&P 500 index with market timing”
Tere Markus
Kas oleks võimalik postidada hinnagraafik koos 200 päeva keskmisega. Olen algaja ja ei saanud aru kuidas näiteks 2015 läks asi rahasse. Muidu mõte väga meeldib. Huvitav kuidas oleks sama asi Nasdaq 100 ga. Võib vastata in english.
Hi Andrus!
If you look at the daily chart with a 200-day simple moving average of S&P 500 index, you see that the last day of August in 2015 closed below the 200-day MA, so it sold and went into cash at the next open (1st of Sept, 2015). Though it uses daily chart, the signal is taken only at the last day of the month and trade is executed at the next open. This is to avoid false signals when price jumps up and down around the moving average, end-of-month smoothes it out. I don’t have data for Nasdaq 100 but I’d expect it work similarly due to the strategy being simple and robust. Hope that explains!
Hi. Backtesting looks good. I have a question about intramonth vulnerabilities for sharp drops. Should there be some extra layer of protection?
Hi! This strategy works well over time thanks to the “volatility pain”. As soon as I start applying a tight stop loss to save a single trade from volatility, the overall robustness and longevity go away. Besides exiting a losing trade at the strategy level, there are two additional layers of protection for me at the portfolio level – the allocation size to a strategy that also affects each position’s size, and a diversified portfolio of uncorrelated strategies.
Hi Markus,
quite interesting study. Do you think, that exact end of month play some role in the method, or any 30days intevral can work the same? Have you tested some other periods (shorther or longer)?
Hi! Moving the date from end of month won’t change the long-term result much, and any other date in a 30-day interval can have a better or worse outcome in short-term just by pure luck (unluck) and randomness in the markets, but I have found that end of month has some long-term edge, probably b/c of how funds and institutions manage their exposure. Changing the length of the interval will just change the trade distribution, like going longer will have less trades and higher drawdowns, going too short will trade noise and increase trading costs.