Crazy times in the world, huh? A year ago today, I was flying to NYC to meet other traders and attend a trading workshop. Can’t imagine that opportunity right now. However, something has stuck with me ever since.
When I was on the plane, I was listening to a podcast that played an excerpt of Alan Watts, a British writer and speaker who passed away in early ’70s. Tho he had nothing to do with financial markets in particular, his speech felt to me like he was talking about my trading at the time. The message stuck in my mind and there I was, wandering in the streets of New York, listening to it again several times. Here it is:
This video is embedded from YouTube. All copyrights belong to the respected owner.
Decision-making in the market crash
In March, I wrote how I had got out of the US stock market in late February to preserve capital (see here). Fear was hitting the markets and all my indicators were short-term oversold. I began preparing my shopping list and was waiting for opportunities to get back in. On the 26th of March I got a buy signal from my $SPX system. The goal is not to pick the bottom (which is impossible to do without luck anyway) but to get back in the market in a reasonable place. I have updated the chart below, where green arrows mark my buy signals and red arrows mark sell signals.
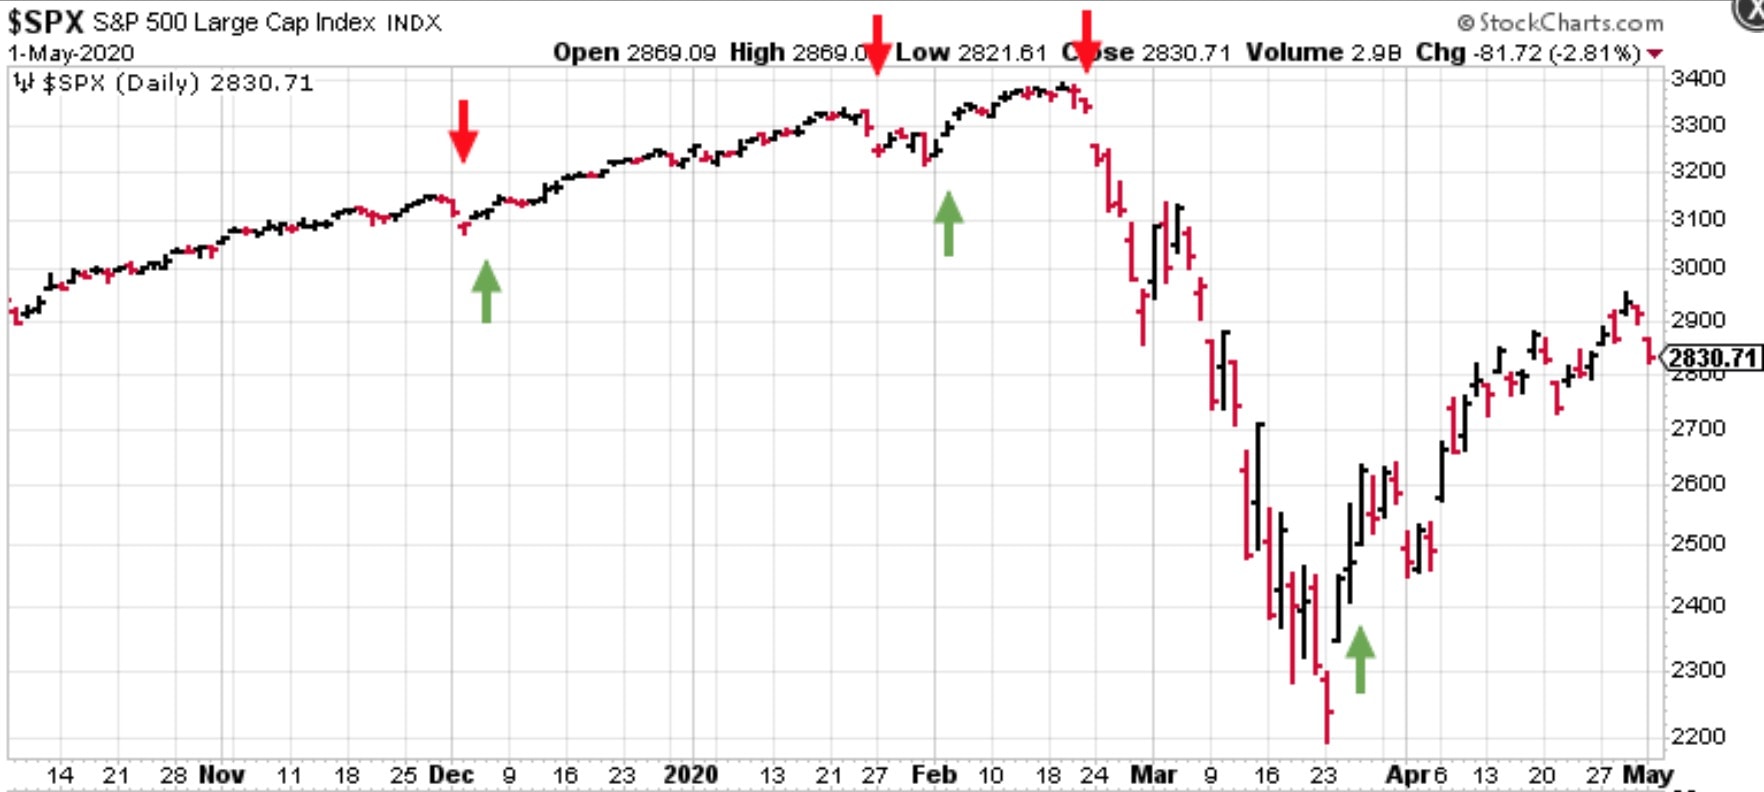
It wasn’t a comfortable time to put on risk but systematic trading can work only by respecting signals. After the buy signal, price fell almost to the place where I would have got a sell signal and cut my loss. However, it consolidated and no more selling pressure came in. We were off to the races. In my current market analysis, we are experiencing a short-term uptrend in a long-term downtrend, but this could change either way now. In theory, 8 out of 10 times the market should test such a bottom as the recent one. There’s a saying “V is what we want, W is what we get” but in December 2018 we got a “V” and there was sharp recovery without a test. One could find infinite reasons why the market should go one way or the other.
In my blog I always show a clean chart to remove any indicator biases. Every trader needs to figure out his or her chart setup, just don’t get overwhelmed with all sort of lines and oscillators. After all, most of the indicators are based on up to five elements: open, high, low, close and volume.
Homework and preparation keep me going
Here is an excerpt of my weekly homework before the 2020 crisis:
- 17 Feb – “The US market is still overbought…”
- 24 Feb – “The market started to pull back…”
- 2 Mar – “A panic sell-off the whole past week…”
To trade successfully in the equity market, you don’t need to know what will happen next if you’re in touch with what’s happening at the moment and manage risk properly. Needless to say, I was already in cash by 2nd of March. In April, I traded some tech stocks like MSFT, NVDA. Not to brag but April was one of my best months to date.
Some traders might feel that experienced technicians know what will happen in the markets. The truth is nobody knows. What one needs to know is how to act in such uncertainty. Disciplined traders can sit out if they don’t have a trading signal and take only quality trades. This is what separates pros from punters. If you have no plan, everything you do is a gamble.
Lesson Learned: The data for any decision is infinite.
Share this post