I wasn’t sure if I wanted to write about this publicly because I found something that boosts long-term momentum results by a lot, and I haven’t seen anyone specifically talk about it. It’s a very broad and simple factor added to momentum, so the few people reading my blog obviously can’t saturate the edge away. I’m sure people using computers to find edges have discovered it long ago, but for me, it was just surprising that I haven’t heard about it.
Simply put, dividing a momentum factor by the last closing price for ranking stocks favors fast-moving stocks that have a lower stock price. Whether you measure momentum with breakouts, rate of change, up-down days, linear regression, relative strength index, or moving averages, it can be beneficial to favor lower-priced stocks. I tried it in different scenarios for US large cap stocks, and it always increased annual return by several percentage points.
What surprised me was that market capitalization wasn’t the factor — favoring smaller stocks by market cap (price x shares) in the large cap space didn’t provide this benefit. Volatility didn’t explain it either. Simply favoring lower-priced stocks when comparing similar momentum stocks made a huge difference.
Below is an example based on the MOMO strategy I wrote about here: From $100K to $4.5M: The 30-minute-a-month strategy
I didn’t change anything else in the code besides adjusting the “momentum formula” to “momentum formula / last close” to select which stocks to buy.
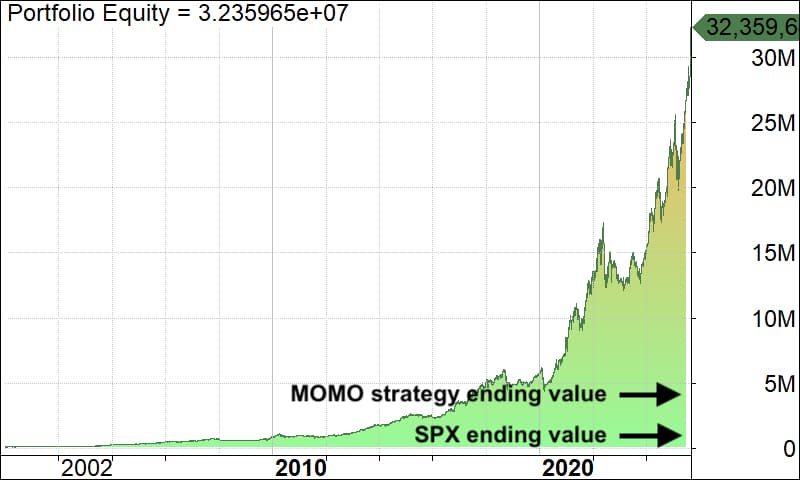
Annual return increased from 16% to 25%!
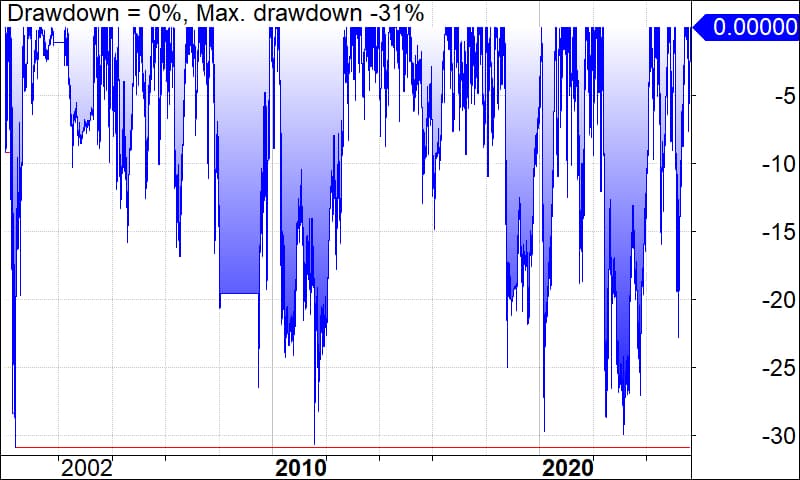
Maximum drawdown improved from -42% to -31%.
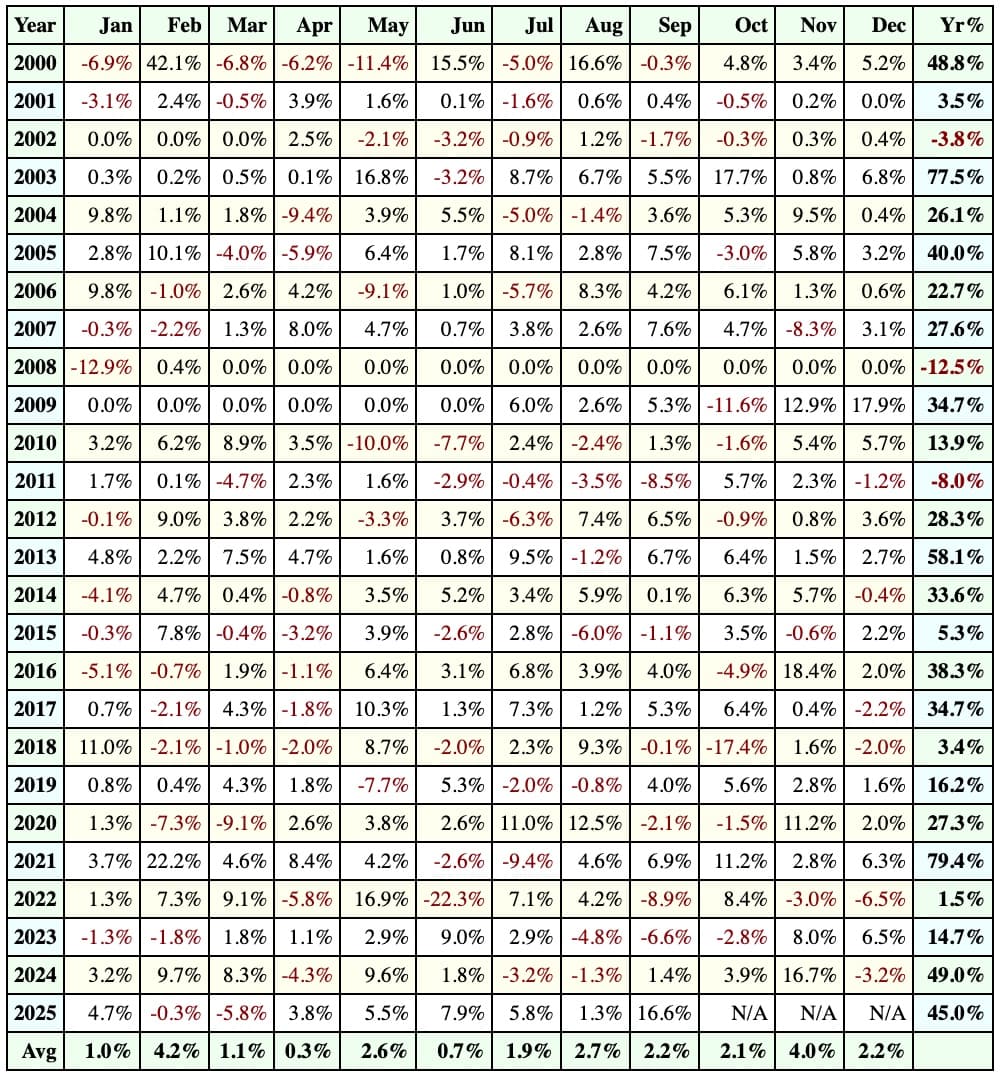
It has been stable across the years, as you can see in the profit table. The sample size includes thousands of stocks and thousands of trades over 25 years of price data. This “lower price edge” has been consistent throughout the backtest – it’s not just boosting overall results because of some earlier period.
Don’t confuse this with small cap stocks. I’m not talking about market cap, but purely stock price — comparing large cap stocks to each other, apples to apples.
I’m not rushing to change the MOMO strategy. It’s up to each person to decide if they think this is worth exploring. For me, the MOMO strategy is based on years of experience, and I understand why it works. Right now, I treat this as an empirical phenomenon in the data, but I don’t have a theory for why it should matter. Especially today, when buying fractional shares is possible, the price alone shouldn’t matter — yet the results have been good even in recent years.
I suspect stock price might have some psychological effect, but I don’t think that alone explains the impact. I’ll be doing more research to see if it can be meaningfully added to a momentum strategy. Feel free to share your own theories in the comments.
Update 2 Oct: More research revealed that the added benefit from closing price was due to stock splits in price data that picked future winners (splits) creating a look-ahead bias – something that can affect results when using absolute price levels because the data is adjusted backwards for stock splits, but is good for backtesting indicators and relative price levels, which I have done so far. More details in the comments, thanks Jürgen! The original MOMO strategy remains valid and is a viable strategy: link.
Share this post
4 replies on “A surprising twist that boosts long-term momentum results”
Interesting analysis, thank you for sharing!
From my experience, whenever a simple rule yields such huge improvement, then my first thought goes directly how this could in some way be leaking future information into the decision. Secondly the return itself looks almost too good to be true for a simple (in a good way) trend following system without leverage. Again raising a red flag for me.
When I heard the podcast my thoughts went to the way how Norgate Data treats stock-splits and dividends. My theory is that stock that has split many times will look historically lower to create a continuous price data without large drops (on split date). For backtesting this is mostly fine as long as you look at percentage changes of prices and use technical indicators. But I believe you can’t use that adjusted price data to reference absolute price levels. E.g., with random example AAPL could have traded at $100 in the past, but Norgate would assume it was at $25 back then if the stock did a 4-1 split at some point.
So my guess is that this rule will prefer stocks that have done a lot of stock splits (i.e., historical price level is lower). Stocks that have more splits are of course the ones that have performed extremely well. So the rule is preferring stocks that “will go up a lot and will be splitting in the future”. Information that you can’t have at the moment when entering a position.
This is my theory. It should be easy to test by looking at the historical trade list and checking what prices Norgate uses for entries/exits. Were these realistic prices that were trading back then? Furthermore, I believe Norgate Data has an option to change backtest mode with or without adjusments for splits/dividends. If the prices look fine and the unadjusted backtest yields similar results, then my theory doesn’t hold. Finally, this theory would assume that this rule has a larger effect in the past and shouldn’t have that big effect in the recent years (less time to have splits).
I will check this on my side as well, just haven’t had time to dig in yet. For my own trend following strategy (most likely quite similar) it created similar level of improvement from the added “/Close” rule for PositionScore.
Good points, thanks! I was thinking about it for a second, but didn’t go that deep cause usually the adjusted prices are good for backtesting and Norgate Data has a good reputation for having clean price data. I can test with splits adjusted or raw data where charts “break” at splits, and then decide if having dividend adjustments on top of it or not. Dividends prob matter less, but splits can create false expectations if they are future adjusted for the backtest engine, which like you said, creates a look-ahead bias to the future. On the other hand, using raw data will have trends crash suddenly which actually didn’t happen. So one option is to do both tests and manually go through the data to see how many positions were affected by artificial split price vs immature exit by a split “crash”. I need to do some more research before jumping to conclusions.
I now checked this theory with a trend following strategy and unfortunately it holds true. The improvement is driven by the future leakage of picking winners that will have stock split in the future. I used Amibroker with Norgate Data.
Few examples:
1995-Oct: ORCL adj. price in backtest was $2.8, real price $43.6
1995-Oct: NKE adj. price in backtest was $3.64, real price $56
1999-Mar: AAPL adj. price in backtest was $0.2, real price $27.5
Using adj. prices with “/Close” gave CAGR 22.4%, max DD -30.6%.
Unadjusted prices with “/Close” gave CAGR 15.7%, max DD -39.3%
Adj. prices without “/Close” (original) gave 16.5%, max DD -38.7%
Version with unadjusted prices gave slightly worse result than original strategy that doesn’t care about price levels. This is expected as unadjusted prices include also “losses” from some splits that in reality would not be losses. But it still clearly differentiated that the improved result is coming from the adjusted (low) prices that don’t exist in reality when trading live.
I am slightly sad that this didn’t end up being an amazing system return booster, but I think it is a good example where sharing ideas openly, discussing and learning together is a win-win for everyone. This discussion was possible only thanks to the blog post 🙂
Thanks for the feedback! Yes, I also see now that there is no added benefit. Norgate has actually a straightforward function to reference unadjusted Close price in AmiBroker:
oc = NorgateOriginalCloseTimeSeries();
I’ve never used absolute price levels like that before, so it was indeed a good exercise and a lesson learned for me. I added an update to the post for readers.