When you look at the stock market, it might seem like every stock has a chance to make you rich if you just hold on long enough. But research tells a different story. Only about 4% of all stocks ever publicly traded in US created all the wealth that the market has produced beyond government bonds. The other 96% mostly just matched or underperformed those bonds. Even more surprising is that just 1% of stocks are responsible for half of that total wealth. The real money comes from finding those rare winners, but the problem is, we can’t know in advance which ones they will be.
This eye-opening research comes from Hendrik Bessembinder, a finance professor who analyzed every US stock that went public between 1926 and 2016. He found that the average stock underperformed Treasury bills over its lifetime. The tiny fraction of about 4% of stocks delivered all of the market’s net wealth creation beyond risk-free returns. And around 1% of stocks, companies like Apple, Amazon and Microsoft accounted for roughly half of all gains. This challenges the idea that simply holding a broad range of stocks guarantees big profits. Instead, the market’s success depends heavily on a very small group of winners.
That’s why I rely on trend and momentum factors to tilt the odds of catching the outliers in my favor. This way, I focus on holding the stocks that are moving up, without getting stuck in ones that are falling behind. I explained these ideas in my original MOMO strategy post. If you haven’t seen it yet, I recommend checking it out before going further: link.
A backtest that closer reflects real-life trading
I recently ran an updated backtest of the MOMO strategy using over 30 years of US stock data, starting from 1995. This includes delisted stocks that were part of the S&P 500 index at the time, so the test avoids survivorship bias. I also included dividends as they were paid out during holding periods. Instead of comparing results to the $SPX index, I used the SPY ETF because it tracks the S&P 500 and includes dividends. To make the chart easier to read, I used a logarithmic scale. Below are the results and my key takeaway.
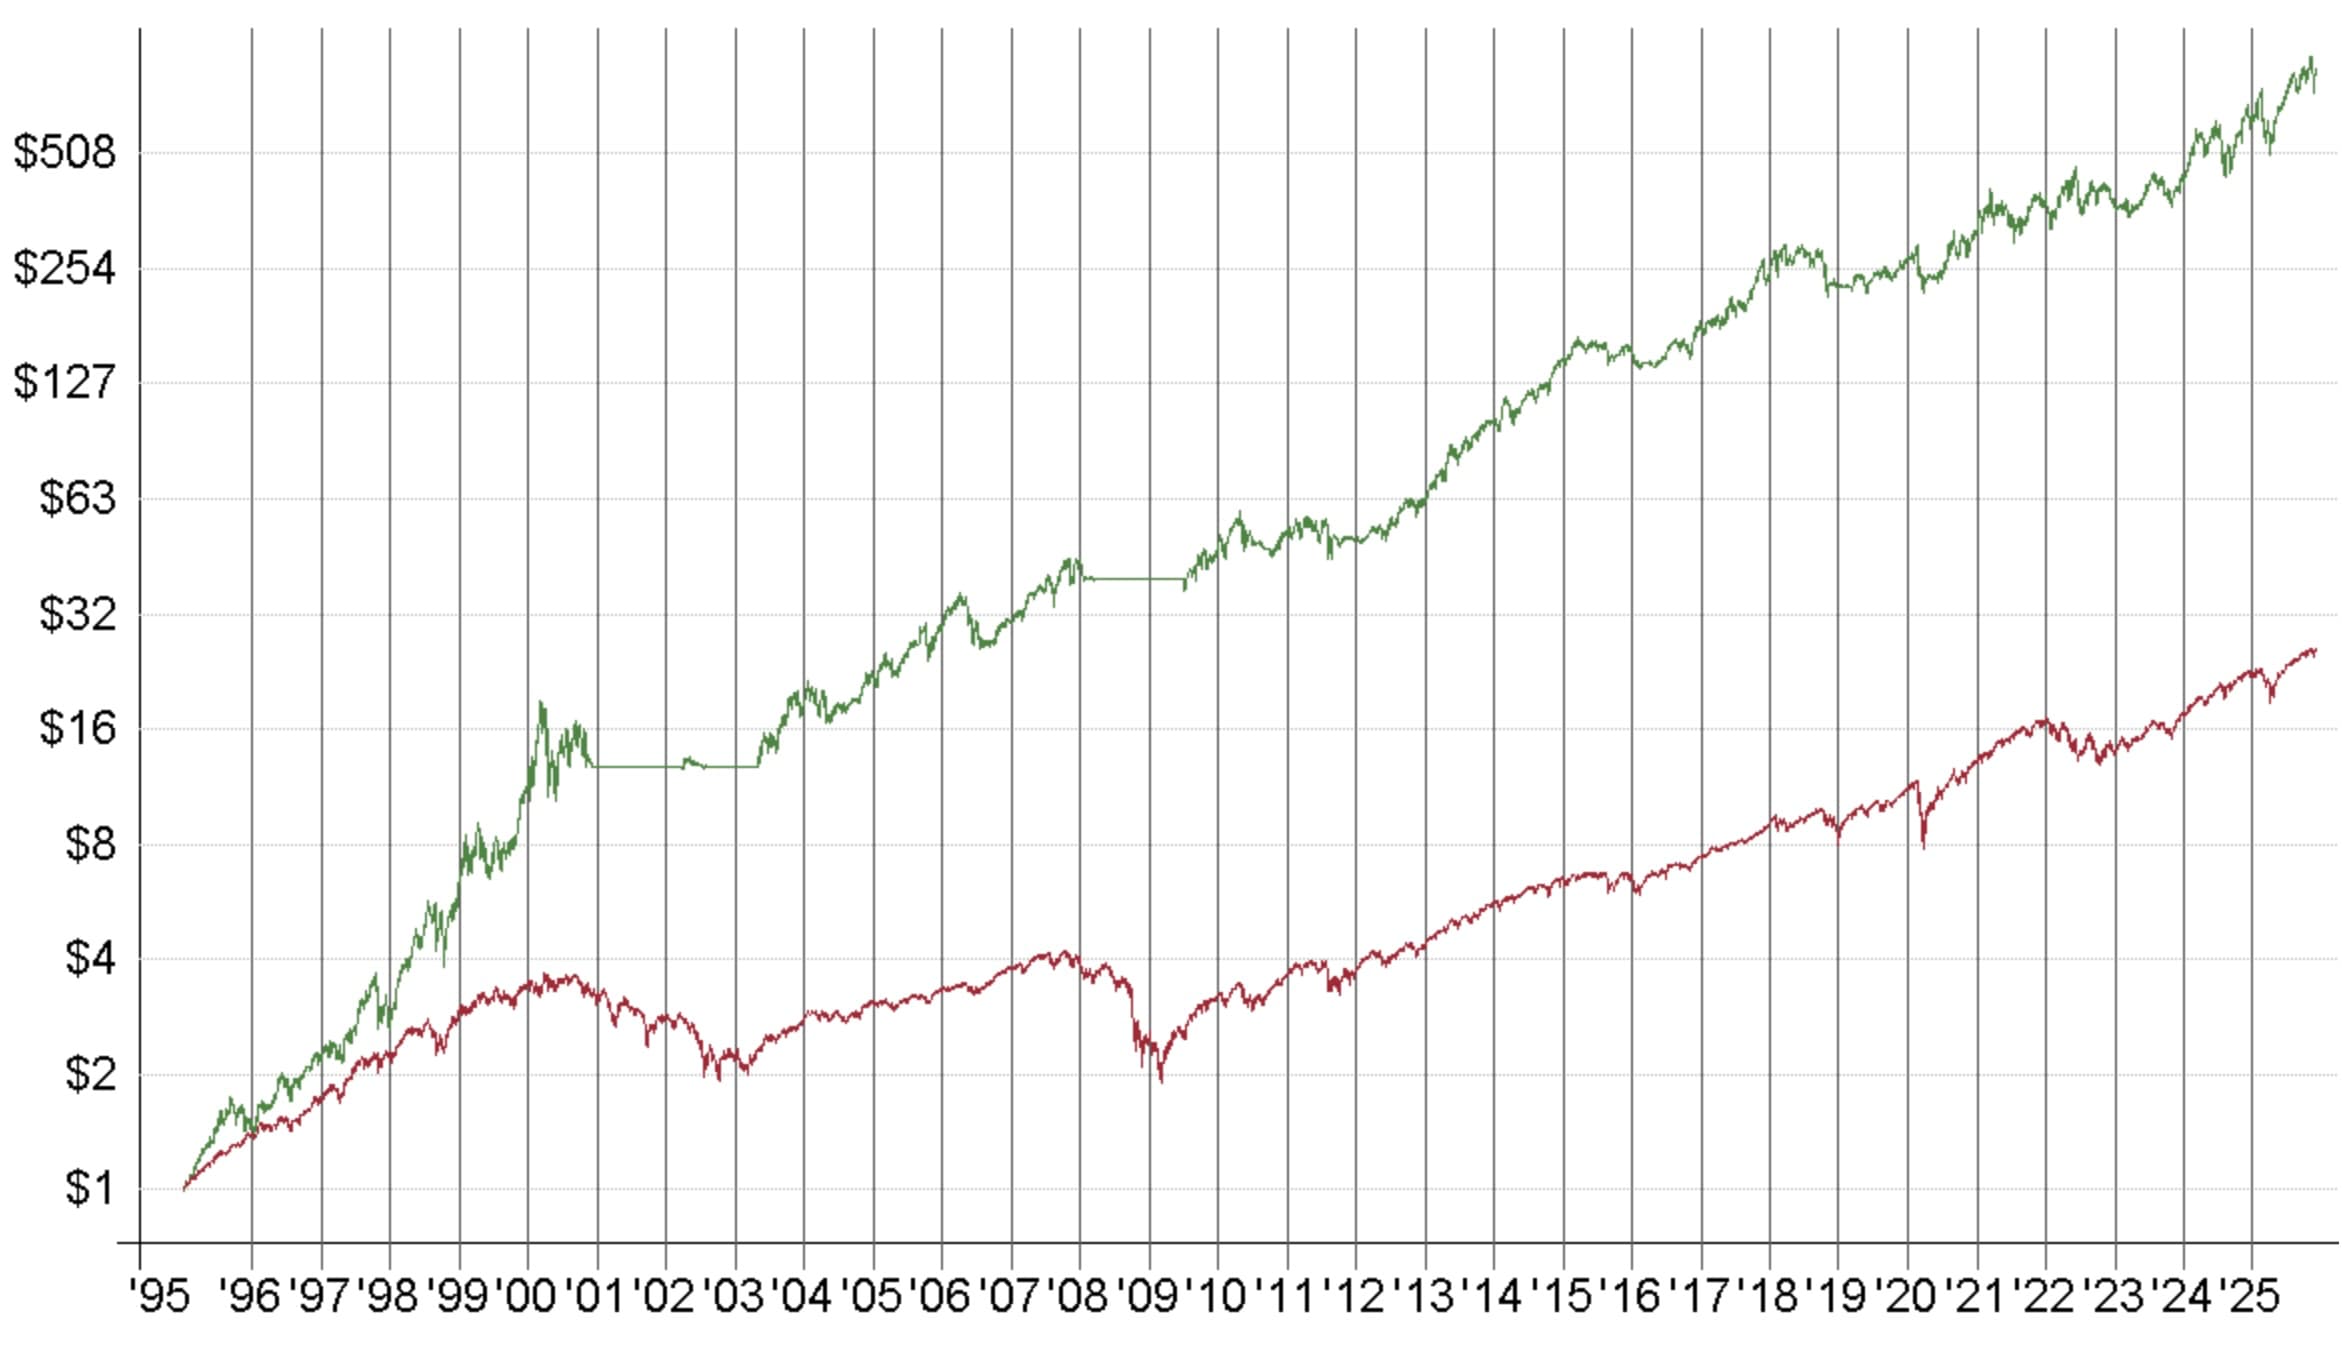
The top green line shows the MOMO strategy, and the red line below is the SPY ETF. Both include dividends and trading costs. You can clearly see how the trend filter helped to avoid big losses during long bear markets, protecting capital, while letting gains run and compound in bull markets. Over these 30 years, MOMO outperformed SPY by 3300%, that’s 34 times better. Honestly, it always makes me smile when people say beating the index is impossible.
3 Jan 1995 – 5 Dec 2025
| MOMO strategy | SPY buy-and-hold | |
| Initial capital | $100,000 | $100,000 |
| Ending value | $84,889,360 | $2,475,963 |
| Trades | 1157 | 1 |
| Win rate | 53.0% | N/A |
| Annual return | 24.3% | 10.9% |
| MaxDD | -45.4% | -55.2% |
Imagine all news and opinions crafted on the 30-year price chart
What if you didn’t know all the chattering by market participants?! It’s tough to ignore financial news and everyone’s market opinions because the constant buzz is addictive. But all that noise doesn’t help you make money. In fact, it usually leads to the same mistakes with everyone else. I’ve got more disciplined about this. I haven’t opened financial news in the last three months and only listened to a few select podcast episodes that avoid prediction fluff. It’s boring, sure. But boring is what makes money in the markets.
The way I approach trading
Experience gives me a theory on how markets work. I backtest that theory and turn it into a trading system. Then it’s all about following the system with discipline, that’s the only thing that matters. I’ve tuned out as much noise as possible, keeping only essential info from my broker, data provider and exchanges, so I know if anything important changes.
Share this post