2020 was indeed a very interesting year in the stock market: markets in turmoil in March like the world was going to end, yolo calls by Robinhooders in April, the market recovering in summer, US presidential election, and many parabolic moves at the end of the year (TSLA and Bitcoin to me personally). It was an educative and successful year for me.
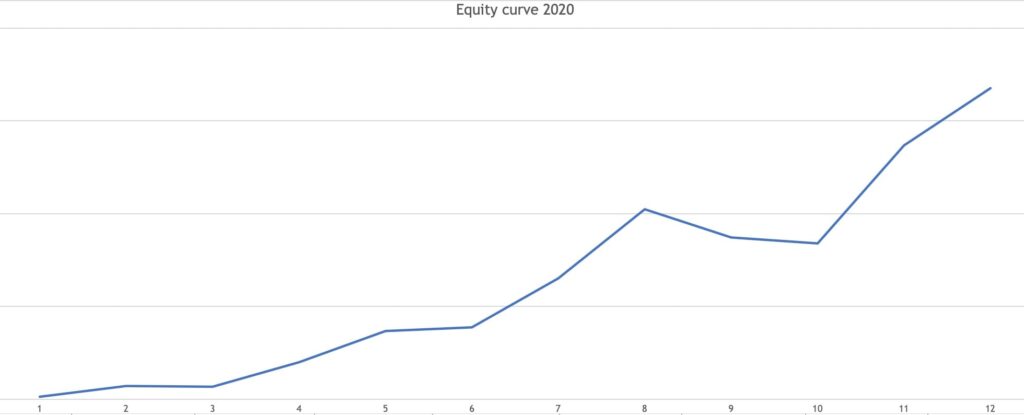
However, it’s not always rosy even if the longer period ends in good profit. Below is my monthly open equity curve for 2020. As you can see, I was in a drawdown for two months in the fall. No big deal at the time, it was part of my trading system’s expectancy. But what if a trader doesn’t know the trading expectancy? Well, in such case he or she most probably can’t know the risk of ruin, which means the risk of the trader not being able to continue trading. My calculated risk of ruin is 0%. If it’s higher I’d suggest to stop trading until one understands what it means. Besides money management, part of the answer lies in win rate and avg. win / loss ratio that I’m about to share below the chart.
I had 50 stock trades in 2020 which is less than in previous years, mostly because in March I was in cash and the second part of the year we had nice long trends. Longs definitely dominated the few shorts as the March decline happened so fast, my system is designed not to participate in such volatility, but go into cash instead and live to fight another day. My only activity in March was to hedge USD with euros, gold and Bitcoin, due to my trading business is in US dollars. But let’s look at some stats:
Win rate: 60%
Avg. win / loss: 3,45
Profit factor: 5,18
To my surprise, the overall stats of 2020 are not that much better than longs only in 2019 (my shorts lost money in 2019). But the stats are still above my average and I’m not expecting that to continue going forward. My total % return last year was in mid-double digits which is very good. To summarize, for every dollar lost I made $5.18.
I read many new trading books in 2020 and will continue to do so in 2021, introducing good literature to my blog readers. I smile when I hear someone tell trading books are worthless. If the person reading a book expects to get up-to-date market information or quick path to riches, the problem lies in the reader not the book. Books forward the experience and thought process of the author but it’s up to every reader themselves how they interpret it. All books are not created equal, though.
I’ve started to share my performance with blog readers: Performance. Every month I update the return table with the equity curve respectively to show you how my trading system is doing in live.
Fellow Estonians who want to stay more in touch with my stock market activity, I invite you to subscribe to the YouTube channel Börsijutud, where I’m one of the co-hosts (no English, sorry).
All in all, a rule-based trend-following trading system can be a good store of value. One never knows when a trend begins but participating in a possible move can get you on a nice ride. The high returns of 2020 don’t matter anymore. We are in 2021 at the right edge of the chart, and we need to keep making new decisions. Stay humble!
Share this post
4 replies on “A bubble is a bull market you are not participating in”
This one feels tough to follow
>My total % return last year was in mid-double digits which is very good.
~50%?
>To summarize, for every dollar lost I made $5.18.
5.18x = 518%?
Your first statement is correct. But the second.. for every dollar lost (not invested) I made back $5.18, that is profit factor which you get by: total wins / total losses = profit factor (5,18)
Suggest a book or three on investment strategies (Ben Graham is a check 🤪). Or any other investment related you found especially useful. Thanks.
To be honest, I haven’t read too many investing books. However, I recently finished two books by Mebane Faber (Global Asset Allocation, Global Value) and will soon review them here in my blog. The first one compares investing strategies of Ray Dalio, Warren Buffett, Harry Browne, Rob Arnott and few others. The conclusion is that their returns over a longer time period did not differ that much at all…