The past is not a good guide to make predictions about the future because the future will be different. One should take as little as possible but as much as necessary from a backtest. A backtest shows how an idea would have worked out in the past if one followed a specific set of rules. It doesn’t tell anything about its performance going forward. People use backtesting tools to come up with a strategy. This is called fitting the data or curve-fitting. It often falls apart in live trading or just gives miserable results.
It’s so important, so let me tell it again. Backtesting can’t be used to forecast the future and it can’t be used to come up with a strategy. Backtesting is only to validate the statistical significance of a strategic idea on historic data.
This is how it usually works out for new people getting into quant trading:
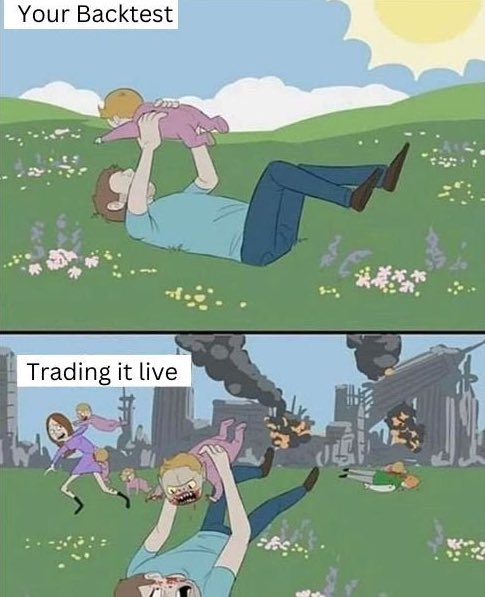
Photo by PyQuant News on LinkedIn: source
Even if we don’t over optimize nor curve-fit the strategy to look good on past data, we still use the past data and whenever we backtest anything on historical prices, it’s going to be a fit of some sort on that price data. That’s why one needs to be extremely mindful when doing research with past price data. It also applies to all the “when this happened, then this will happen next” type of charts or “the man who saw the ’08 crash says this will happen” shared on social media and news. Most of the time it’s random BS in a statistical sense. One of the main reasons is low sample size. If the market fell on two Mondays straight, does it mean that the market is going to fall on Mondays?!
How to think about backtesting the right way
Backtesting gives a better understanding of risk and trade management, drawdowns and recovery, compounding capital over time, how an edge plays out, why a strategy makes money, how an account can blow up with too much risk or leverage etc. I’ve done enough backtesting to understand a new strategy by just looking at its technical components and trade mechanics. It’s all about adjusting risk vs reward, entry / exit mechanics, position sizing, diversification, which combined together make up the trade distribution and return profile for a strategy. So if I think of a new strategic idea, I can first close my eyes and already imagine the trade distribution and return profile for that particular style without running a backtest software. Of course, I should still do that to validate my thoughts, but the main point is not the exact result or profit from a backtest, but how to combine different edges and manage risk at the portfolio level using a basket of uncorrelated strategies, without knowing what the future path will look like.
My job as a trader is to put odds in my favor and manage risk. It’s not what most people think that is to sit in front of screens and try to predict the next move or a winning stock. It’s just pure math and working with data. The market hours are only for executing a predetermined trading plan. The market hours are not for trying to outsmart the next candlestick on a chart.
The stock market is an ever-changing environment
I think the market has technically changed a lot in the past 5 years. You just can’t look at short-term candlestick patterns on a chart and expect it to show investors’ behavior. Most of the trading done today is by bots and algos. A lot of action is in the huge derivatives markets, where market makers hedge their books throughout the day, so the charts show a random distribution of trades created by sell and buy orders in the book. We may see a heavy sell-off one day, a strong rally the next, or the market tanking into close after a quiet sideways day, and things don’t often make sense. I accept it and consider charts to be just a visual representation of data, which most of it is noise in short-term anyway. The idea behind a market index like S&P 500 used to be that the index follows stocks like AAPL, MSFT etc, but today it seems that AAPL and MSFT are following the index trading, at least in the shorter term space. It’s like the tail is wagging the dog. We’ll see how extreme it can go and what kind of effect it may have on the market.
What is backtesting in trading?
Backtesting means applying a fixed set of trading rules to historical prices and recording every trade the rules would have made: entries, exits, position size, costs. The output is a list of trades and an equity curve, and from those the numbers that matter: return per year, win rate, average win against average loss, and the maximum drawdown. It answers one question only: how would these exact rules have behaved on this exact data? Everything I wrote above is about not asking it more than that.
How to backtest a trading strategy without fooling yourself
This is the order I work in, and most of it is about protecting the test from me:
- Write the idea down before you touch the data. Why should it work? Who is on the other side of the trade? If there is no reason, the backtest can only find luck.
- Fix the rules completely. Entry, exit, stop, position size, which markets. If a rule needs judgment, a computer can’t test it and neither can you.
- Use only what you would have known at the time. A signal that needs tomorrow’s close, a swing high that is only visible five days later, or today’s list of index members used for a test from 2005 (the survivors) all make the past look better than it was.
- Get enough trades. Twenty trades is an anecdote. I want a few hundred before I believe a win rate, which usually means more markets or a longer history rather than more rules.
- Include costs and slippage. Commissions, the spread and a worse fill than the close. Fast strategies with small average profits often disappear here.
- Hold data back. Build on one period and test once on another it has never seen (out-of-sample). If you keep re-testing on the hold-out until it looks good, it isn’t out-of-sample any more.
- Compare with doing nothing. A stock strategy that makes 7% a year has to beat buy and hold after costs, or at least do it with a much smaller drawdown.
- Look at the drawdown before the return. The worst drawdown is the number that decides whether you will actually keep following the rules when it happens live.
Then trade it small. Live results with real money are the only out-of-sample test that can’t be fooled.
Examples of backtests on this site
The Setup Lab tests one classic chart signal at a time with the same scorecard. The golden cross on the S&P 500 since 1970 made 7.5% a year against 8.4% for buy and hold, with a maximum drawdown of −34% against −57%. Less return for less pain, which is the trade-off rule 7 is about. The exit signal of that test sounds scarier than it is: after 27 S&P 500 death crosses since 1971, the next 12 months looked about the same as from any random day. My RSI divergence test found only 22 classic bearish signals in 20 years, which is exactly the small-sample problem from rule 4. The hammer candle at the 50-day moving average is even rarer: 8 trades on the S&P 500 in almost 13 years, and it lost 0.6% a year while the index made 11.9%. Setup Lab test 7, buying gold at the lower Bollinger Band, won 78% of its 106 trades and still made only 4.2% a year against 11.0% for holding gold. A high win rate means little until you do rule 7 and compare it with doing nothing. None of these results tells you what happens next year. All of them tell you how the rules behave, and that’s all a backtest can do.