Two core principles behind my stock market approach
Based on years of research, two of my main mantras in the market are:
- Hold the strongest stocks in an uptrend – mathematically the best way to compound wealth.
- Cut back risk in bear markets – mathematically the best way to protect long-term compounding.
It doesn’t need to be technically complicated. The real challenge is having the discipline to stick to the plan through both good and bad periods.
The long-term momentum strategy (MOMO)
In 2021, I created a long-term momentum strategy that does exactly this. It holds up to 10 S&P 500 stocks – the ones doing the “heavy lifting” for the market. The average holding period is around 3 months, but the very strongest stocks can stay in the portfolio for a year or more.
Main stats compared to S&P 500:
(Trading fees included, stock splits adjusted, dividends excluded)
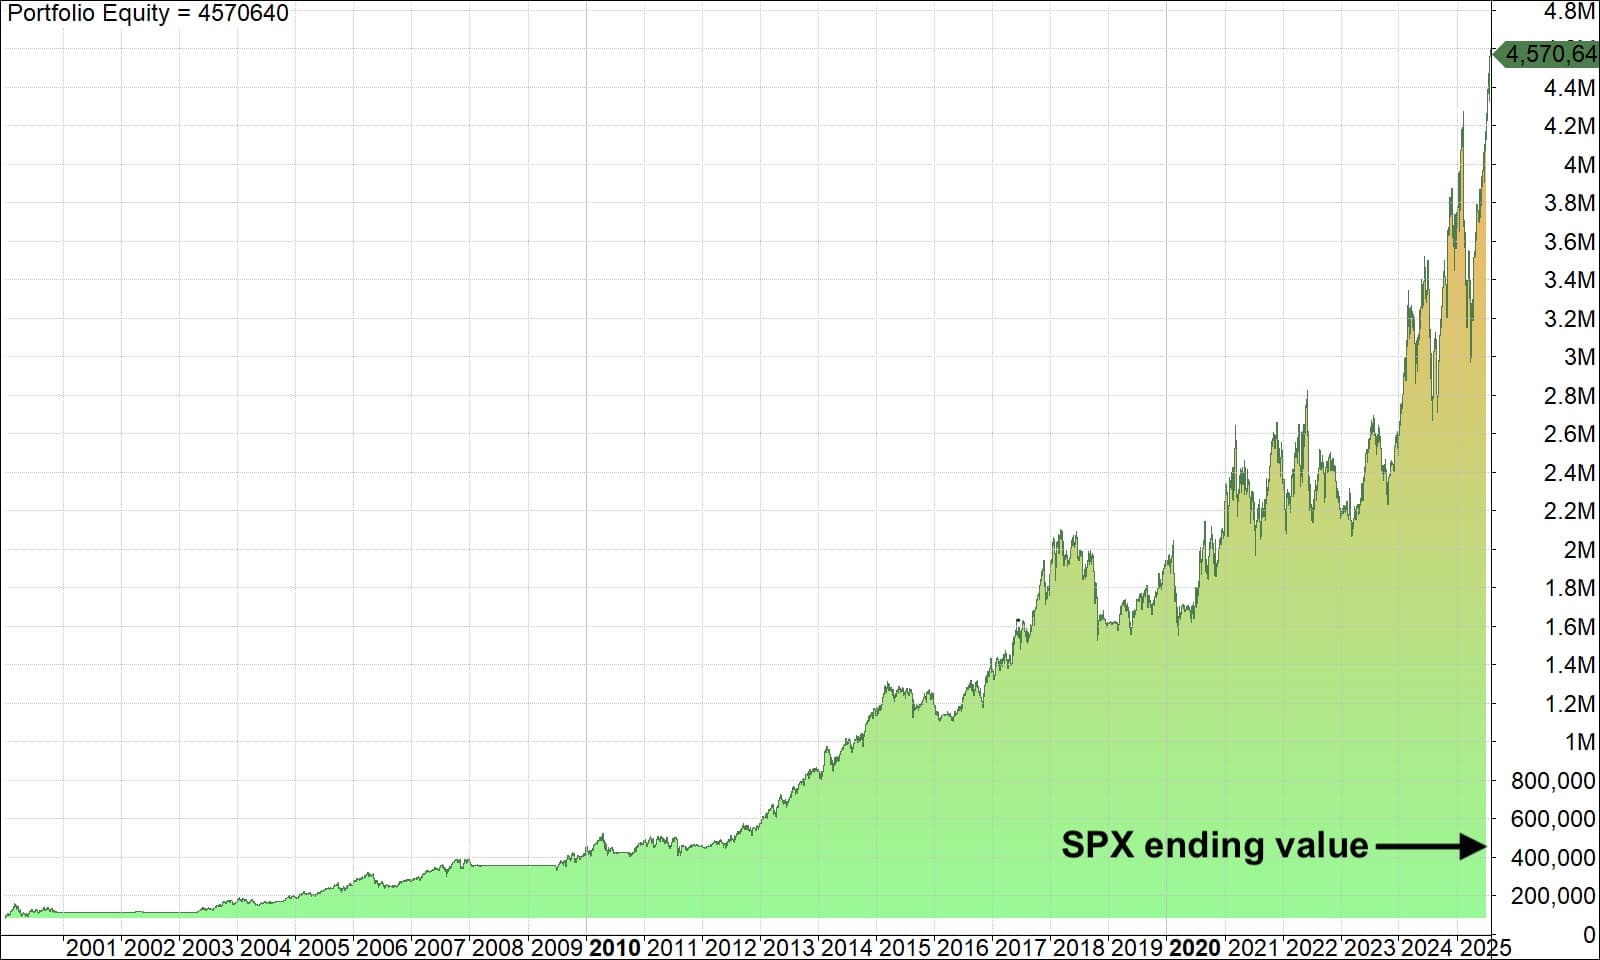
1.01.2000 – 8.08.2025
| MOMO strategy | SPX buy-and-hold | |
| Initial capital | $100,000 | $100,000 |
| Ending value | $4,570,640 | $439,080 |
| Trades | 874 | 1 |
| Win rate | 52.06% | N/A |
| Annual return | 16.09% | 5.95% |
| MaxDD | -42.40% | -56.78% |
The backtest was done using survivorship-bias-free data from Norgate Data. That means stocks that used to be in the S&P 500 but later got delisted or went bankrupt were still included at the time they were actually in the index. For example, in April 2006, the stock picks came from the exact 500 stocks in the index at that time – not just today’s survivors.
Equity curve:
The truth about compounding
You don’t need to chase 200% annual returns or take reckless bets to beat the market over time. The real edge comes from cutting losers and letting winners run.
That said, this approach isn’t without volatility. Stocks need room to breathe, and not every pullback is a sell signal.
Drawdowns:
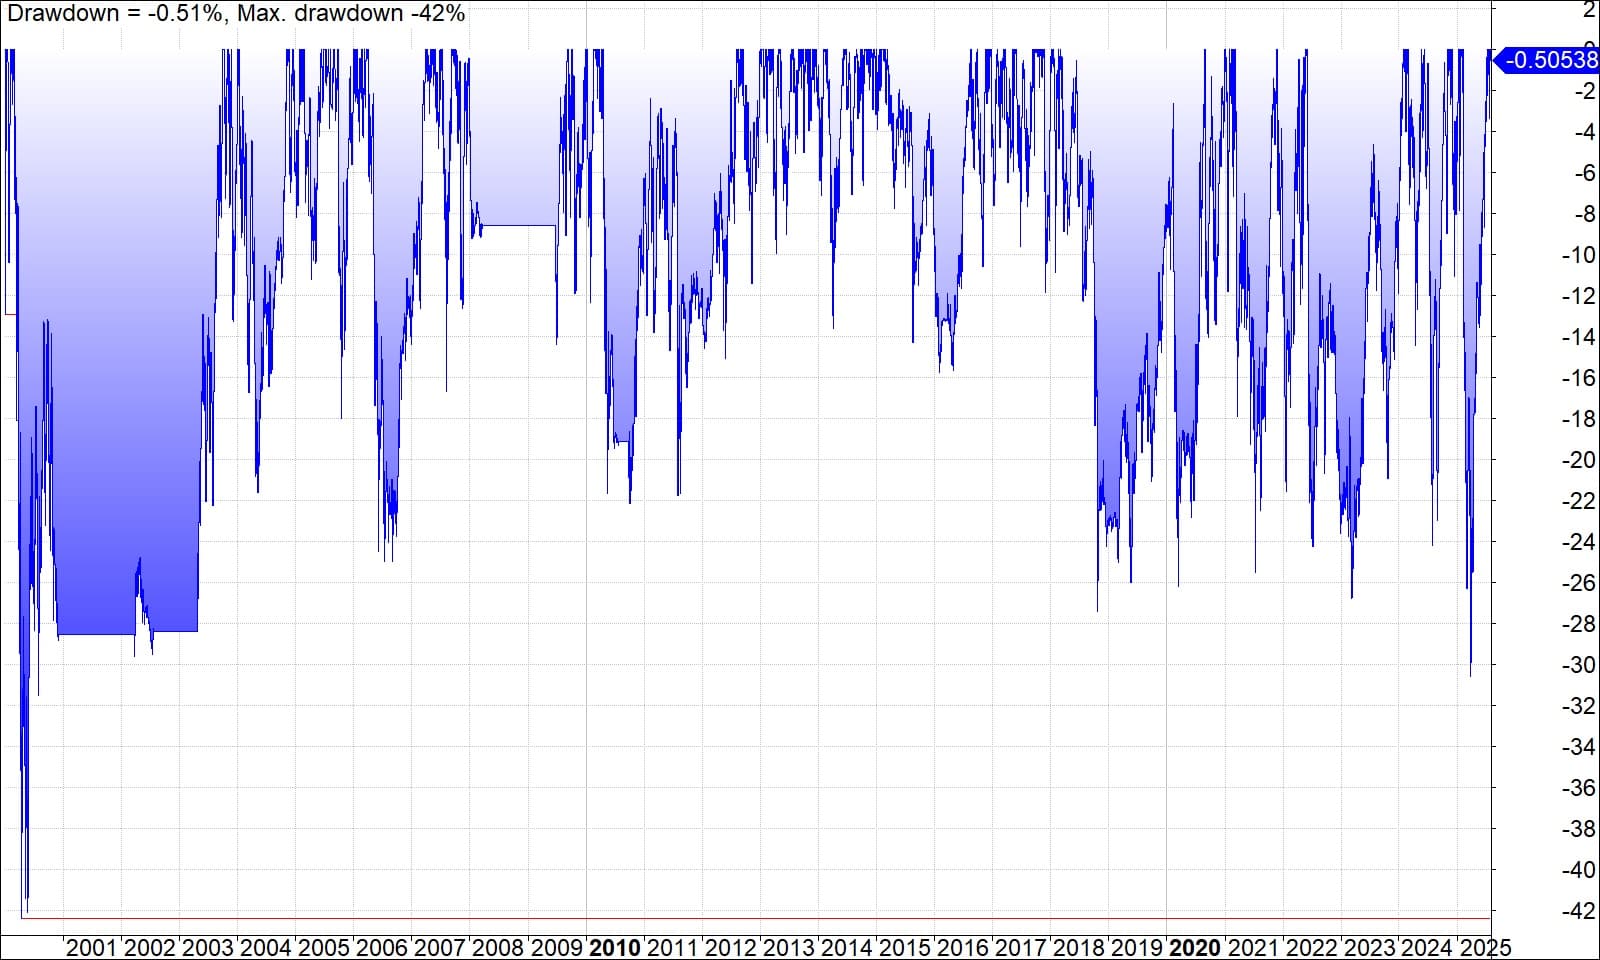
Drawdown is the drop from peak to trough before reaching a new high. The worst drawdown for this strategy was in the early 2000s. Since then, it has stayed under -30%.
That doesn’t guarantee it can’t go deeper in the future, but historically the drawdowns have been stable in both depth and length.
Profit table:
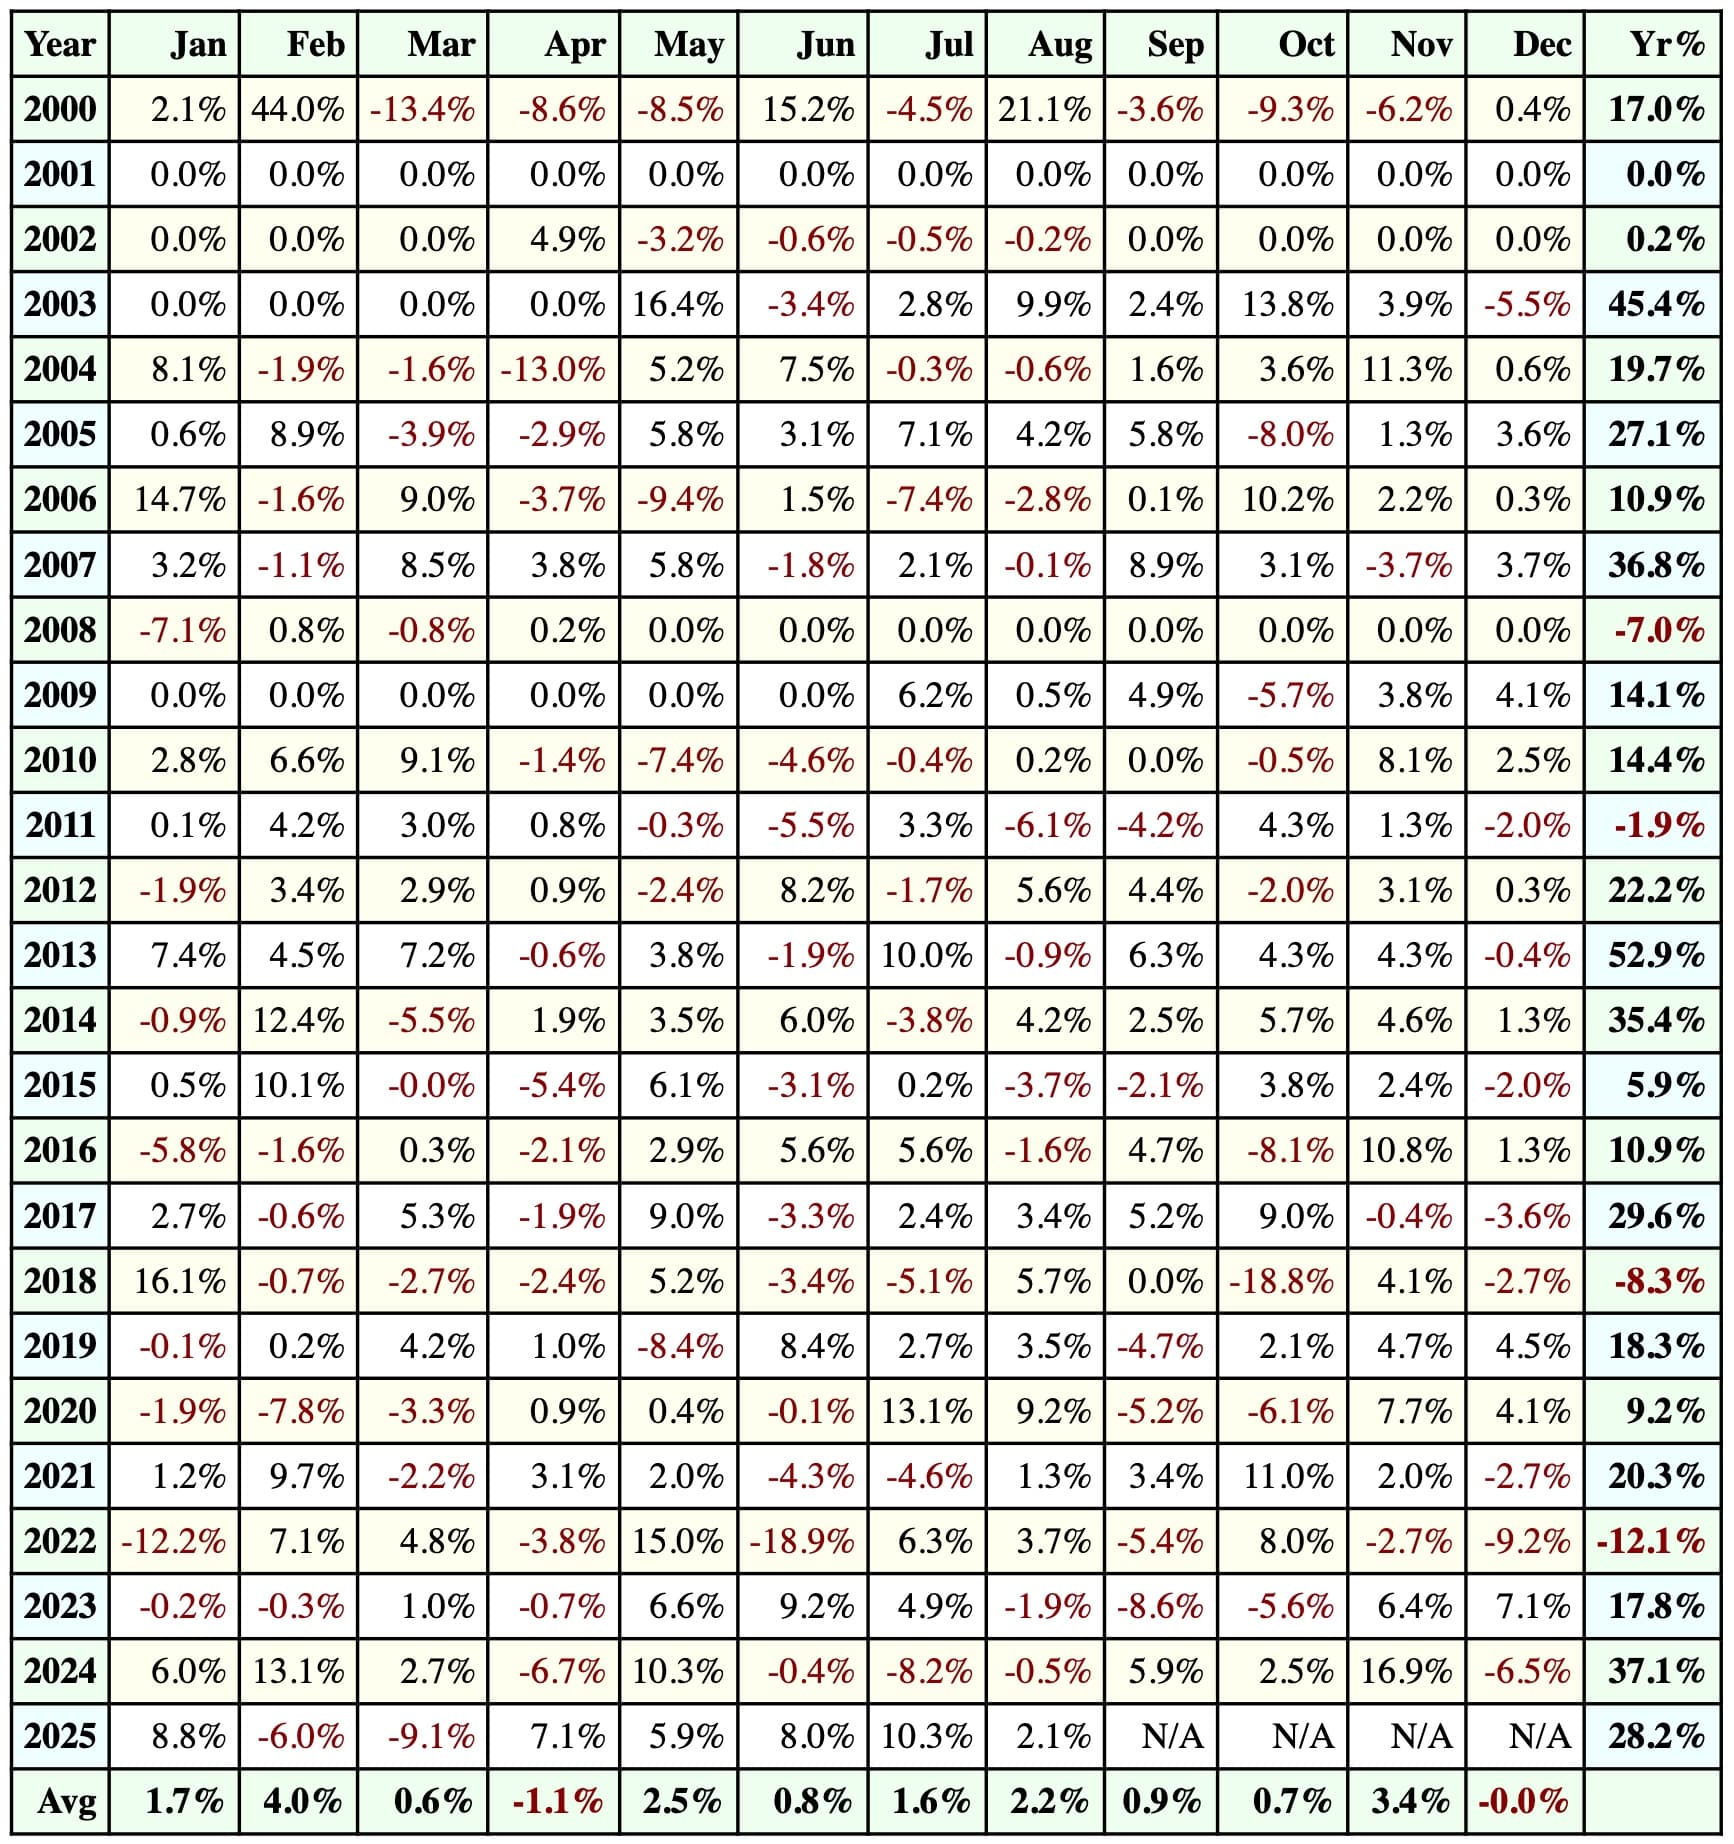
Over the 25-year test, there were 4 losing years – 2008, 2011, 2018, and 2022 – with 2022 being the worst at -12.1%.
Yes, the strategy can be underwater for a while, but strong years make back the losses and more. Patience is key.
How MOMO works
The strategy is simple and rule-based:
- Market regime filter
- Stock trend filter
- Stock selection by momentum factor
- Position sizing rules
- Clear entry and exit conditions
No fundamentals. No news. No guesswork. Just price trends and momentum.
It stays invested in the strongest stocks during bull markets and reduces exposure in bear markets to preserve capital.
Robust, not curve-fitted
The parameters were not optimized to “look good” in a backtest.
They are robust rules that have worked across decades of market history.
When backtested from 1995, the annual return was over 20%. I excluded the unusually strong ’90s for a more realistic view – and it still performs well in recent years.
Low maintenance
Managing the strategy takes about 30 minutes per month. It uses a custom S&P 500 screener that:
- Pulls price data automatically
- Calculates all formulas
- Gives buy/sell signals
Up to 10 positions mean it’s easy to run manually.
I’ve been following this strategy since 2021. While it’s built on strong principles, there are no guarantees – past performance does not ensure future results. The strategy may or may not match its historical performance.
Share this post
10 replies on “From $100K to $4.5M: The 30-minute-a-month strategy”
“I’ve been following this strategy since 2021.”
“I share it as an educational example of quantitative investing and do not recommend trading it with real money.”
So have You used this strategy with Your own money or not?
Up until this year I was trading 3 trend strategies, 10-15 positions each, but decided to put the strategies together into one for better management. So I was trading the exact strategy in 2021-2024. I often hold the same tickers in the portfolio that this strategy gives, just the entry/exit mechanism is a bit different and I have 30-40 trend positions in total for diversification. All principles about trend and momentum remain the same.
The reason I do not recommend it to others is that I am not a financial advisor, and I do not know what suits other peoples’ portfolios or what else they have as diversification. Therefore, everyone needs to make their own decision on what to trade.
Why are you selling your strategy?
Sorry, if I am mistaken, but it looks like trading is no longer generating you the income that you desire. So you need to build a business on top of it.
That’s a fair question. I’ve automated my trading, so my capital is already at work regardless. Sharing the strategy with a limited number of people doesn’t affect my performance, and creating an additional revenue stream on the side is simply a natural business decision. As an entrepreneur, I want to stay busy and keep growing in the industry I enjoy. To me, it looks like a win-win situation.
Thanks for sharing. How did you end up at those annual return values though?
MOMO strategy – initial capital 100k to ending value 4.6m, that is way more than 16%/y, is that a typo?
SPX buy and hold – should have yielded more than 5.95%/y for that period?
Hi!
I measure CAGR (Compound annual growth rate) for annual return to see at which rate the capital grows, not the average of yearly percentages or something else. I gave ChatGPT the inputs and it also gave me 16.1%. No typo.
The SPX index grew at 6% annual rate during the period. This doesn’t include dividends from an ETF like SPY, but the MOMO strategy is also excluding dividends, and MOMO doesn’t include the interest earned while being in cash, so it shouldn’t matter much on a relative basis.
Does the “managing 30 minutes per month” mean that the strategy recalculates once per month? Or is this just the aggregated total time and I would need to trade a few minutes here and there.
The strategy trades once a month. It’s a long-term trend / momentum play, so there is nothing to do everyday but to let the odds play out.
Mind väga huvitab see teema ja strateegia, aga on mõningad kahtlused ja hirmud. Kuna strateegia reeglites on kirjas, et on positsiooni suuruse reeglid, siis kas väiksema algkapitaliga polgi mõtet seda strateegiat kasutada? Tahaksin küll väga proovida, aga olen väga algaja ja kardan, et ei oska strateegit rakendada. Pole just kõige meeldivam väljavaade kuu ostan 500e geniaalse asja, aga ei oska sellega midagi tarka peale hakata. Siiani olen Lightyeari platvormil väiksemaid summasid liigutanud, aga IB kogemus täiesti puudub. Kas oleks midagi julgustavat öelda või peaksin siiski sellisele tasemele pürgimise mõtte praeguste oskuste juures ootele panema?
It’s a simple concept of buying the top stocks based on trend and momentum, then letting winners run meanwhile cutting off losers. Most investors do the opposite not because it’s technically hard to do, BUT because it’s psychologically hard to do. So I think most adult people can understand the strategy rules well intellectually, but if one lacks of experience then probably it will be mentally very hard to stick to the rules of this kind of a strategy. Position sizing rules mean there is a math formula to calculate position sizes, not that there is a minimum requirement of capital. Any brokerage service that offers trading the largest US stocks really fits for the strategy, no special requirements. Of course, risks are involved with choosing the brokerage or running any investment or trading strategy, so everyone needs to do their own due diligence. If you have more questions, you can also send me a private message from the Contact page.