For the past couple of years I’ve heard narratives that the dollar was going to collapse. Who knows, maybe one day it will, but I feel much more comfortable making decisions based on price charts than such narratives.
My trading business is in US dollars because I trade the US markets. I live in the eurozone, so when euro starts to trend higher against the dollar, I hedge my currency risk by going long EUR/USD futures contracts on CME. I haven’t had the need for it since mid-2021 and the dollar has gained 11% meanwhile, 8,5% of it this year alone. It’s funny that the dollar has been my biggest and best performing “position” so far this year. On one hand, I’ve been reducing equity risk since January, so the cash level has been constantly rising but on the other hand, price increase against my home currency basically removes the drawdown if measured in EUR. Of course, I still measure my performance in USD, but just a fun side note. Ironically, the cash position has proven to be good in this inflationary environment when people talk about getting equity exposure due to high inflation.
Let’s look at the $EURUSD chart. It goes back over 20 years and shows the euro compared to the dollar.
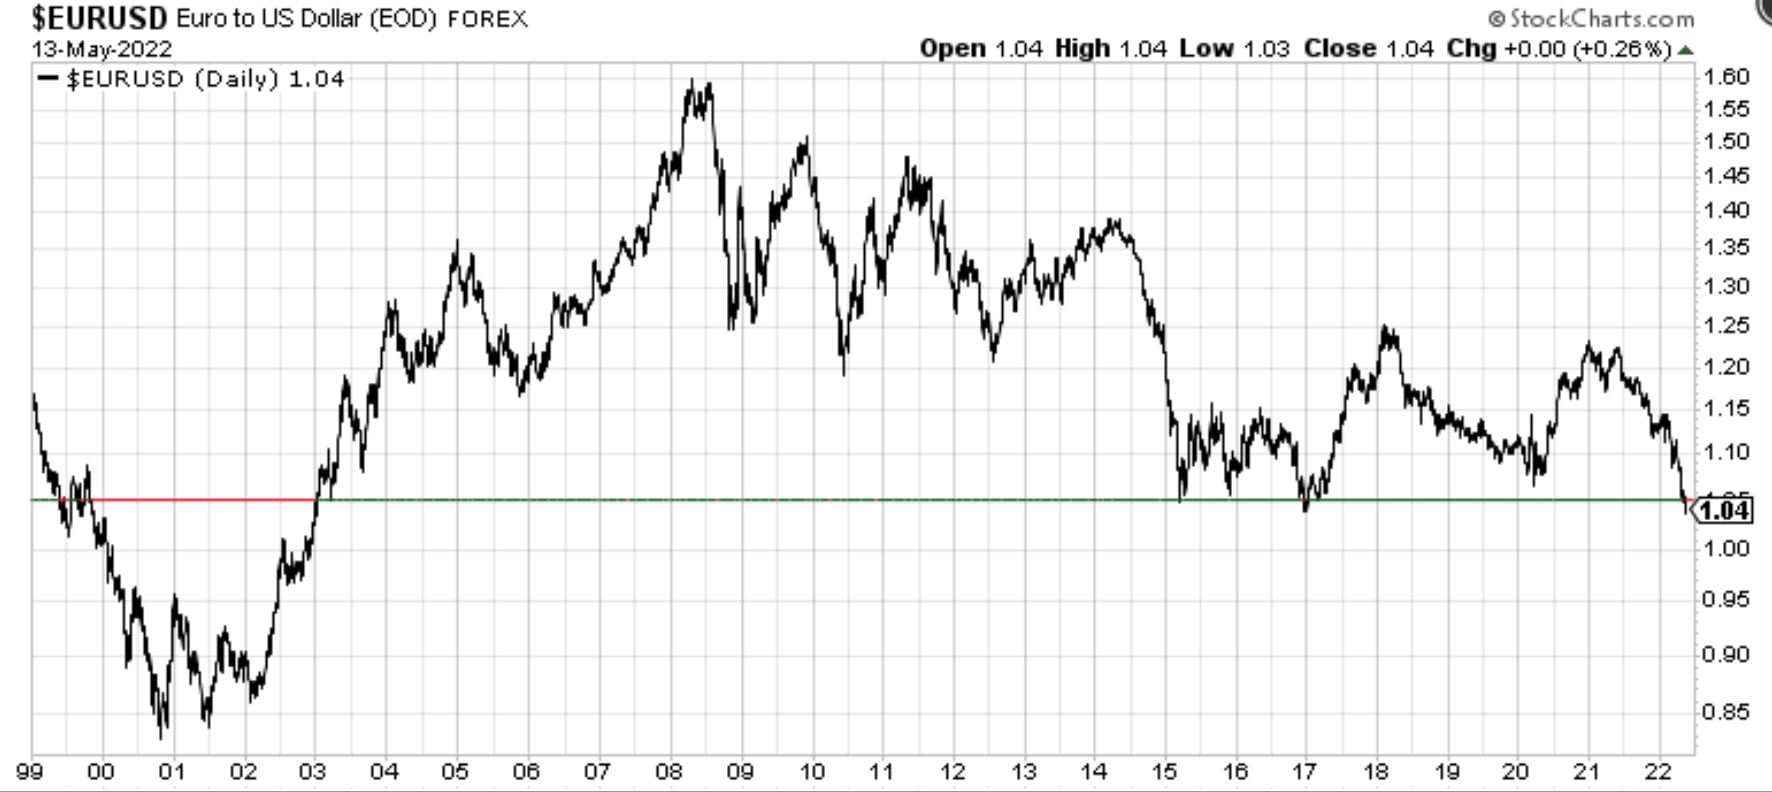
Price is currently at an important level to watch, where it either finds support and makes a retracement against the trend, or has follow-through to the downside. Last time the price was at this level in early 2017, but if it falls further to the downside, it becomes likely that a dollar will cost over one euro, which hasn’t been the case since 2002. I’m not trying to predict the future here, just laying out possible scenarios and being prepared for both outcomes. If it finds support and makes a thrust like in 2017, then it still needs to work through a lot of resistance to reverse the overall trend.
Share this post