I don’t make trading decisions based on sayings that rhyme well. There has been a seasonality expectation that the period of lower performance in equities tends to be from May to October, and the period of higher performance from November to April.
I am a quant and I like to look at data to verify such statements.
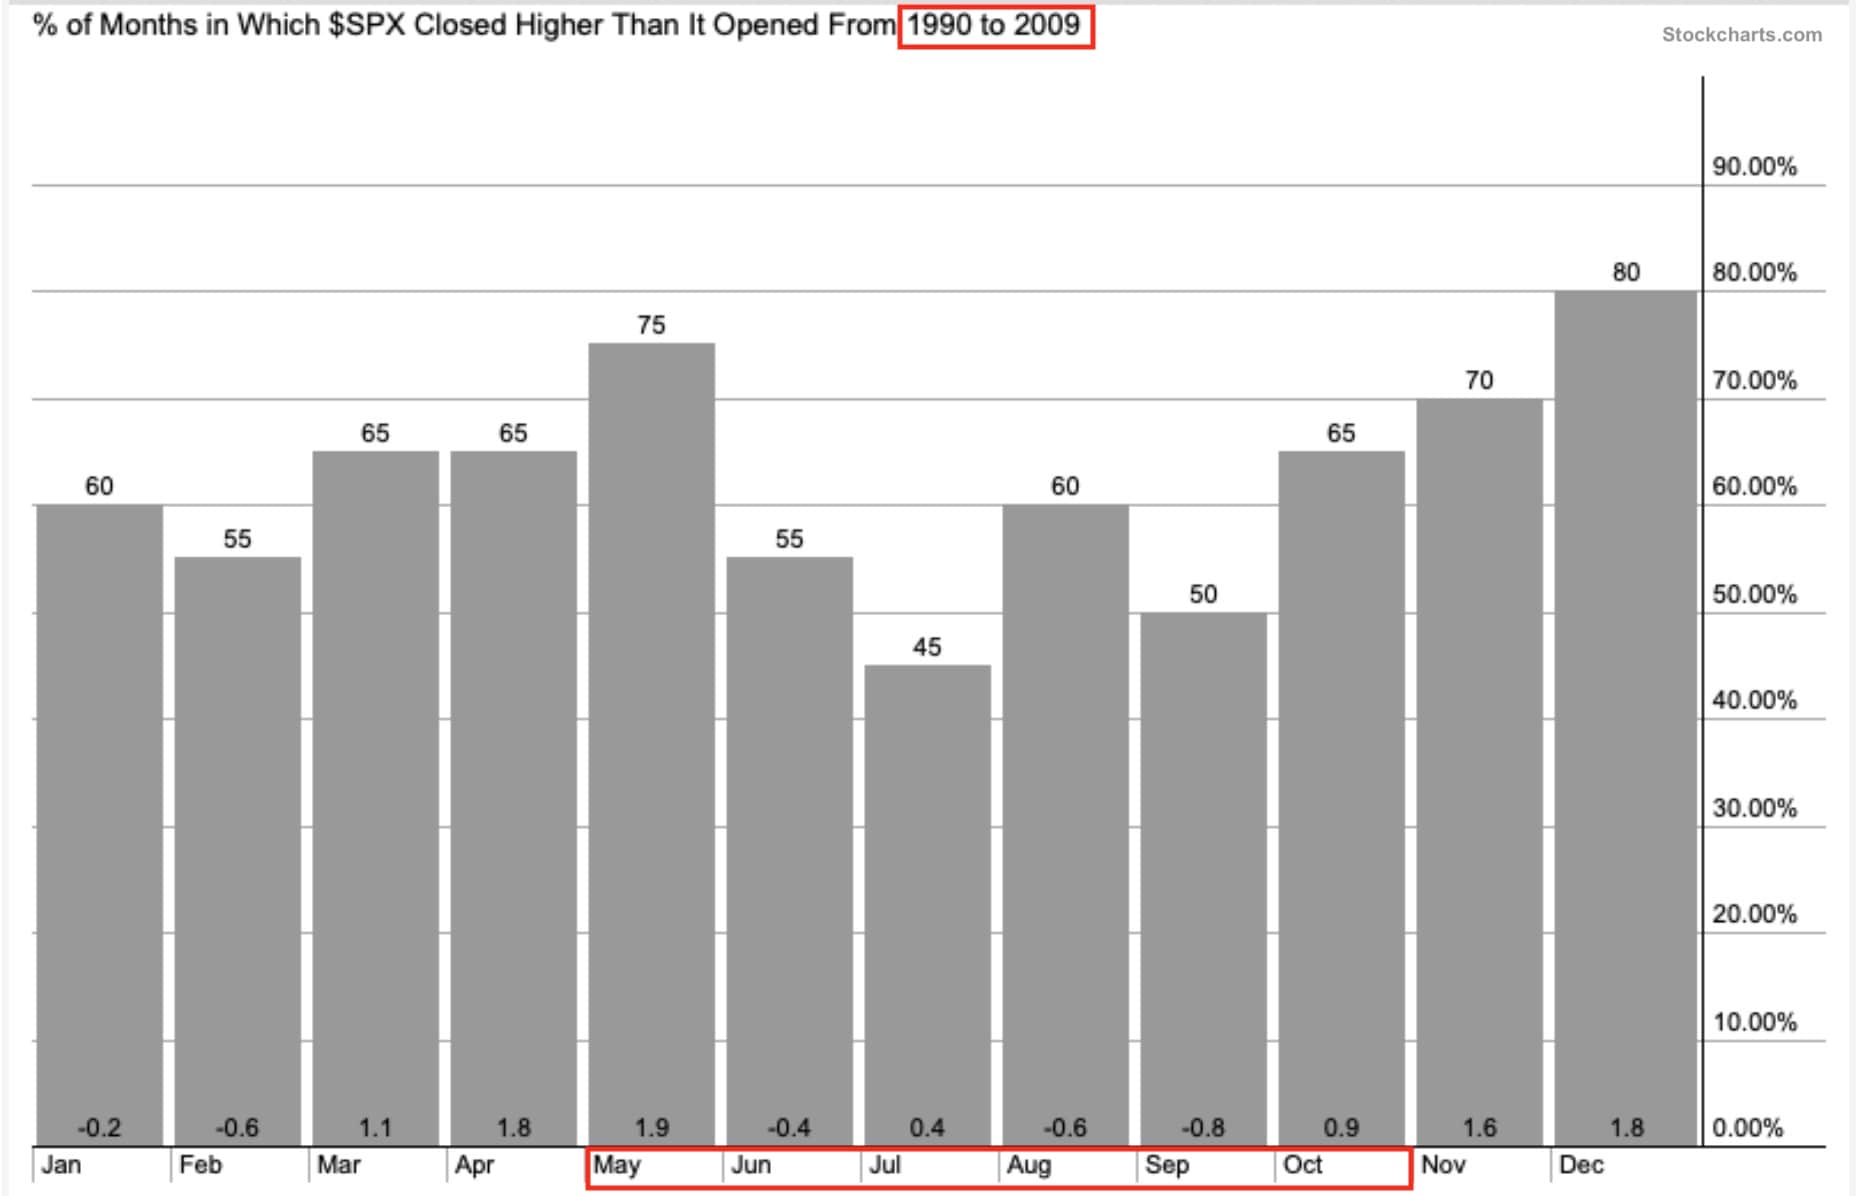
Let’s look at the seasonality chart that shows % of months in which the S&P 500 index closed higher than it opened. The first chart shows 20 years of data from 1990 to 2009. Though May looks actually quite good, there’s a noticeable pattern that summertimes tend to have less up months for $SPX.
Now we’re going to look at 20 years of data from 2002 to 2021. Here the picture is different. Summer hasn’t been worse than the start of the year. April has been the best month and closed higher than the open 80% of the times. Not this year. April closed down by -8.8% in 2022.
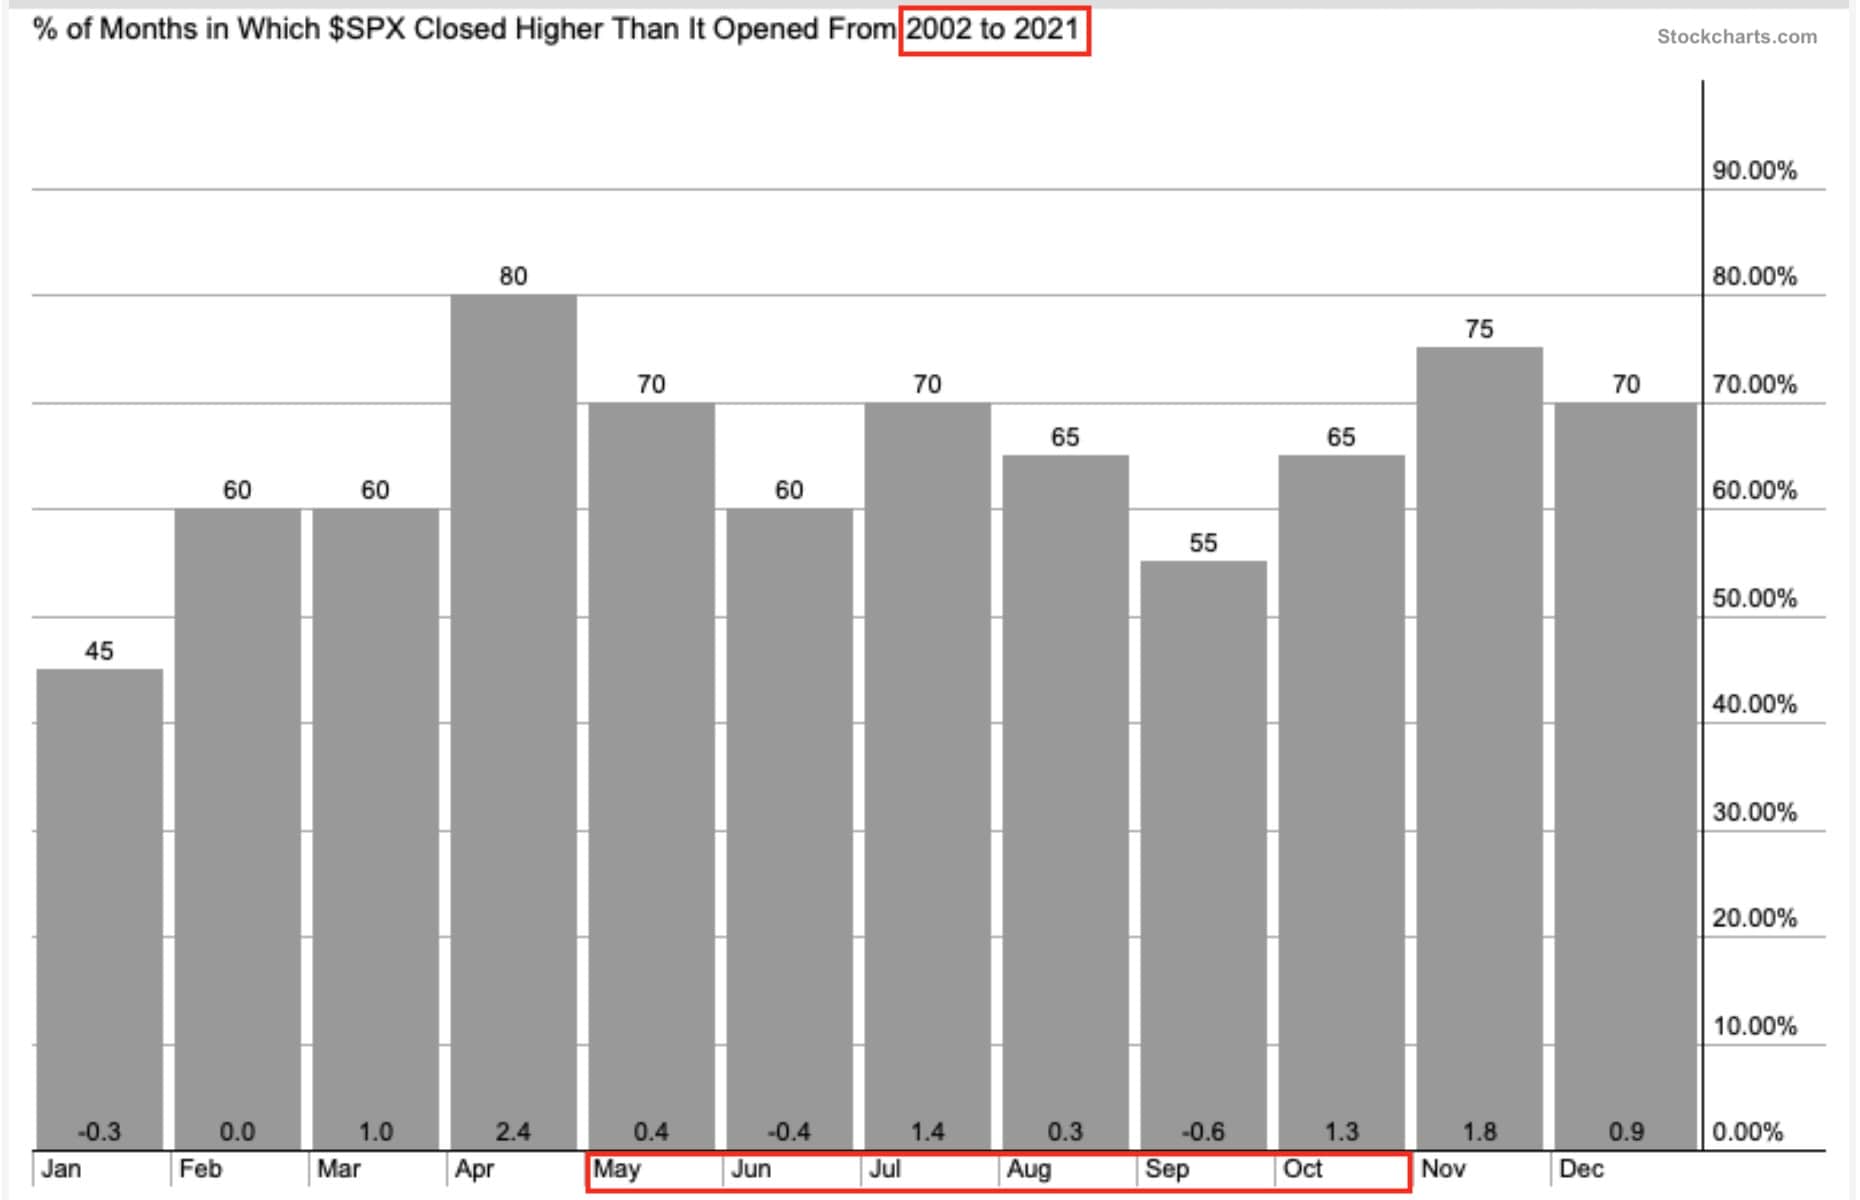
I don’t see any statistical significance here myself to write a seasonality filter into my trading system. The market can do whatever it wants no matter what the current month is.
Does sell in May and go away work? The numbers to 2026
I wrote the part above in April 2022 and only counted up months. A better test is the whole six-month halves, with dividends included. Here is the S&P 500 total return index from 1988: the winter half runs from the last close of October to the last close of April, the summer half from there to the end of October.
| S&P 500 total return | Nov–Apr | May–Oct |
|---|---|---|
| Average | +7.7% | +4.4% |
| Median | +7.8% | +5.4% |
| Years up (of 38) | 30 | 30 |
So the saying isn’t made up. The winter half has been the better one, and the summer half beat the winter before it in only 11 of 37 years. On the price index back to 1950 the gap is bigger: +7.0% for the average winter against +2.1% for the average summer.
The expensive part is the “go away”. A weaker half is still a positive half: the summer made money in 30 of 38 years. I tested the strict version, stocks from November to April and 3-month T-bills from May to October, from the end of April 1988 to the end of April 2026. It made 8.9% a year against 11.4% for simply holding. $10,000 grew to $258,454 instead of $609,323. The one thing it did well was the worst drawdown, −35.6% against −55.3%. And the summer of 2025, which the rule would have sat out, was the best of all 38 at +23.6%. The 2026 summer is up 8.2% so far (to 21 October).
That is why I still have no seasonality filter in my system. If you want the month-by-month version, it is in my post on the worst month for stocks. Another calendar story, what the S&P 500 did after each US midterm vote since 1950, is in midterm elections and the stock market.
Not financial advice. This is educational content, shared for information and entertainment only, and it is not a recommendation to buy or sell any asset. Backtests and past results do not guarantee future results, and the numbers or charts here may contain mistakes. Trading carries risk, including losing all the money you put in. Do your own research before you make any decision.
Not an easy start of the year
This year hasn’t been easy in the markets. It’s the worst start of the year for US stock market since 1988 based on the four months to date, and the third worst start of the year in history. Even though I’m in a drawdown (-10% YTD) that is completely normal and expected for my strategies, I’ve had some unlucky timing with a few general changes in the trading system. I don’t feel bad because a short time period is a random sample in big data and I’m sure the adjustments will pay off in the long run. On the other hand, the day-trade algorithm that I added recently has been making some profit, which is good.
Why I am still selling
I’m almost out of stocks not because of May, but because the US stock market is in a downtrend. There will be oversold bounces and reaction rallies along the way down, but until the overall trend recovers, I’m staying defensive to fight another day. I still trade short-term swings and I do have some short exposure that benefits from the selling pressure. Shorts are not that profitable overall, but they do give some support to portfolio in market downturns.
Persistence to keep pushing the buttons
One of the biggest differences between amateur and professional traders is that beginners tend to scratch their strategy when the going gets rough, try to find something new and better while pros know that a drawdown is inevitable and part of the money making journey. So professional traders stick to their game and benefit from the next upturn. It may not be easy for the human mind, but that’s what makes it difficult hence necessary to be successful in the stock market.