Blog
Bollinger Bands: What 56 years of S&P 500, gold and Bitcoin data show
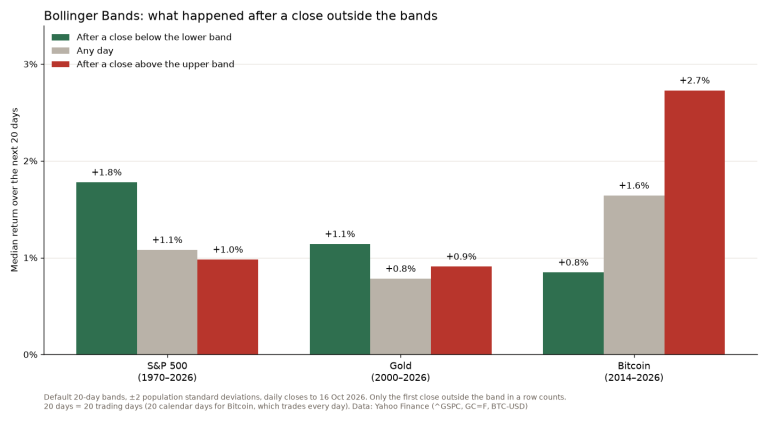
Bollinger Bands are a 20-day moving average with a band two standard deviations above and below it. I tested John Bollinger’s own rules on the S&P…
Everything published on Trader Markus since 2018, newest first.
168 posts · page 2 of 28Bollinger Bands are a 20-day moving average with a band two standard deviations above and below it. I tested John Bollinger’s own rules on the S&P…
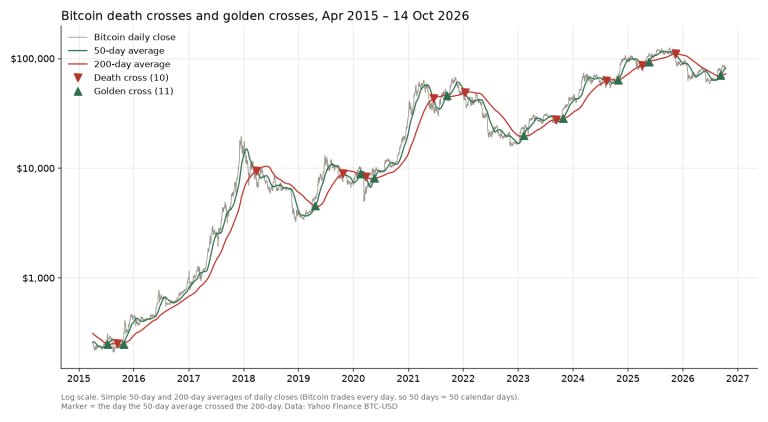
Bitcoin has had 10 death crosses since 2015, the days its 50-day moving average fell below the 200-day. A year later the price was higher after 5 of…
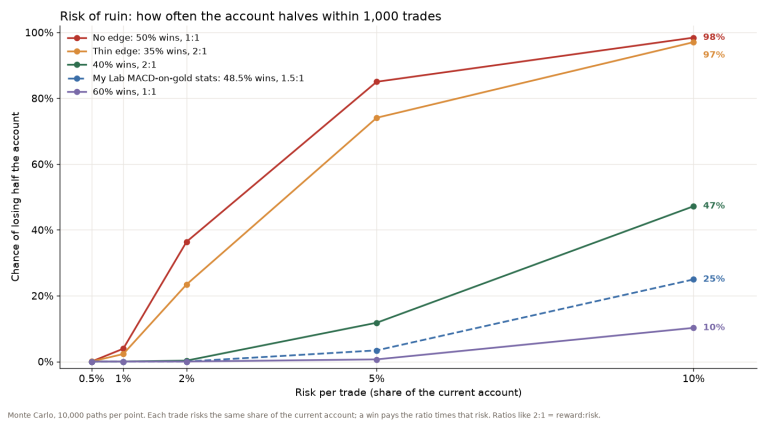
Risk of ruin is the chance that a run of losses takes your account down to a point you can’t come back from. I simulated 1,000 trades, 10,000 times…
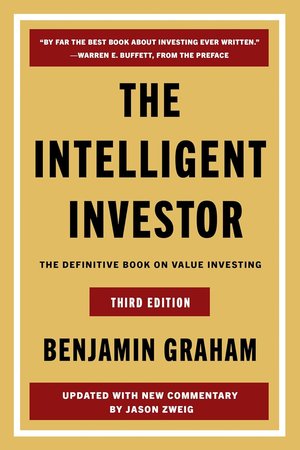
The Intelligent Investor is the book that turned Warren Buffett away from charts. I read it as someone who still uses them, and I’d still put it on…
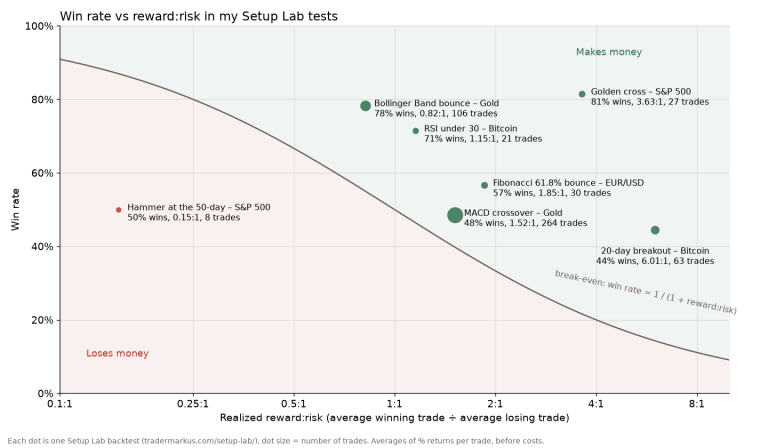
The risk reward ratio compares what a trade can lose, from the entry to the stop, with what it can make, from the entry to the target. Risk $1 to…
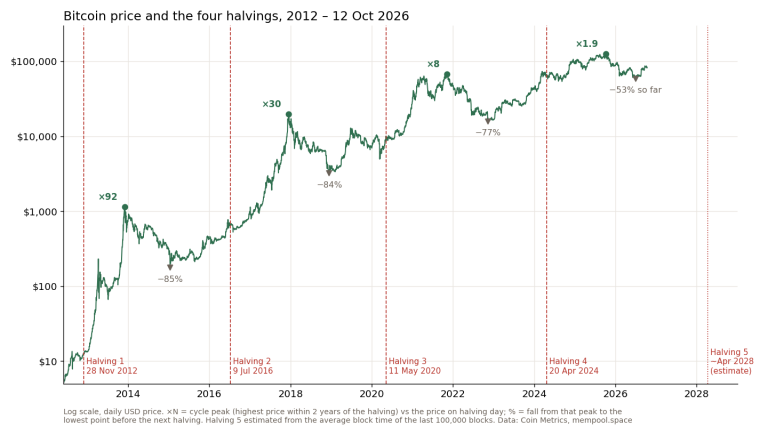
Bitcoin has had four halvings: 28 November 2012, 9 July 2016, 11 May 2020 and 20 April 2024. After each one the price peaked 371 to 546 days later…
Type a word or a book title. Titles, excerpts and tags are searched.