Claude Shannon was an American mathematician, cryptographer, engineer and computer scientist who lived in the 20th century and died in 2001 aged 84. Sometime in the 1960s at MIT he came to a theory of rebalancing that is now called Shannon’s Demon. I saw it randomly already a few years ago on the web and stumbled upon it again now while learning index options. Here’s the concept in a nutshell.
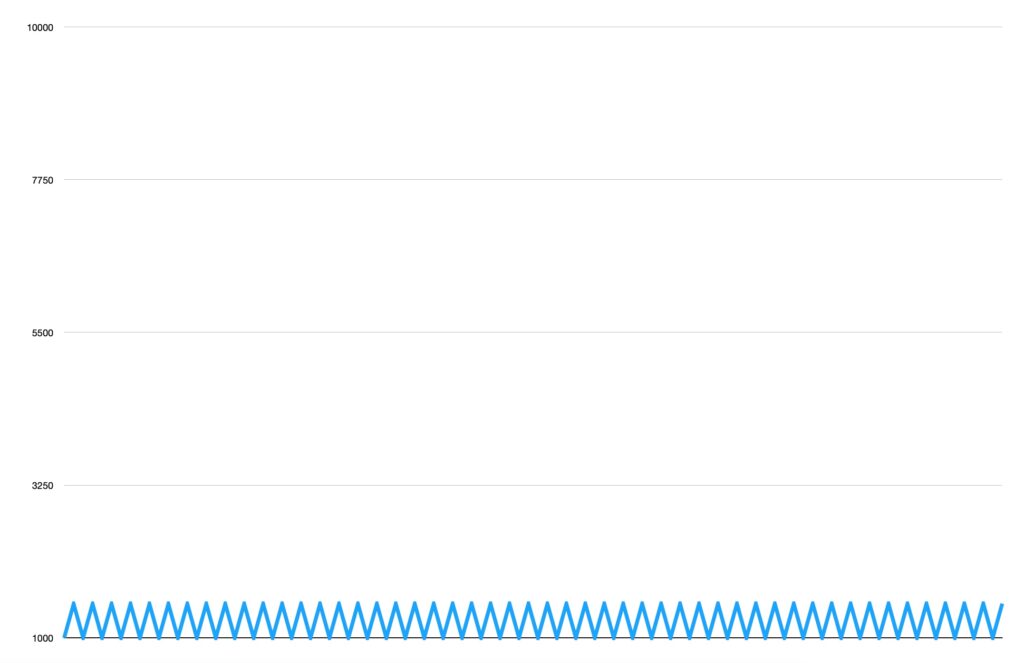
If we have a hundred coin flips with 50/50 odds and each time we either win or lose $500, then in a perfect distribution of coin flips it would look like the outcome below. The equity curve starts with $1000 and keeps winning or losing $500, which makes it flat overall and the expectancy is zero.
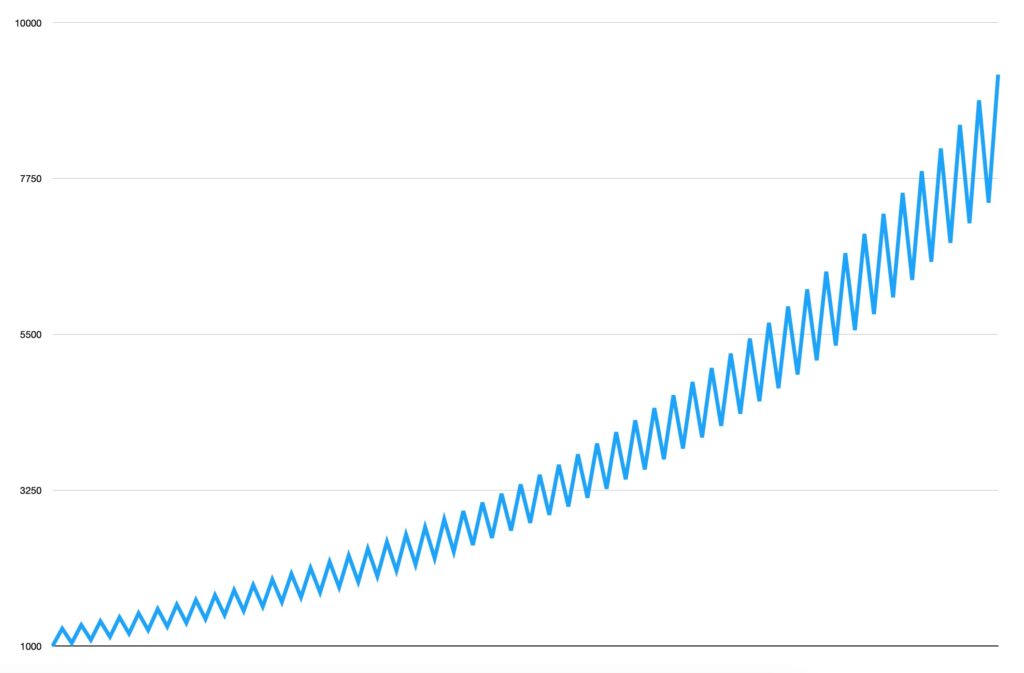
Next, we do the exact same exercise but rebalance 50% into cash after each coin flip and bet the other half on the next flip with the same equal opportunity to win or lose like in our first example, however now as the equity changes, the $500 outcome will change accordingly, keeping it constant in percentages. You can see below how the equity curve has changed and the outcome now has positive expectancy. It went from $1000 to $9000 in one hundred coin flips.
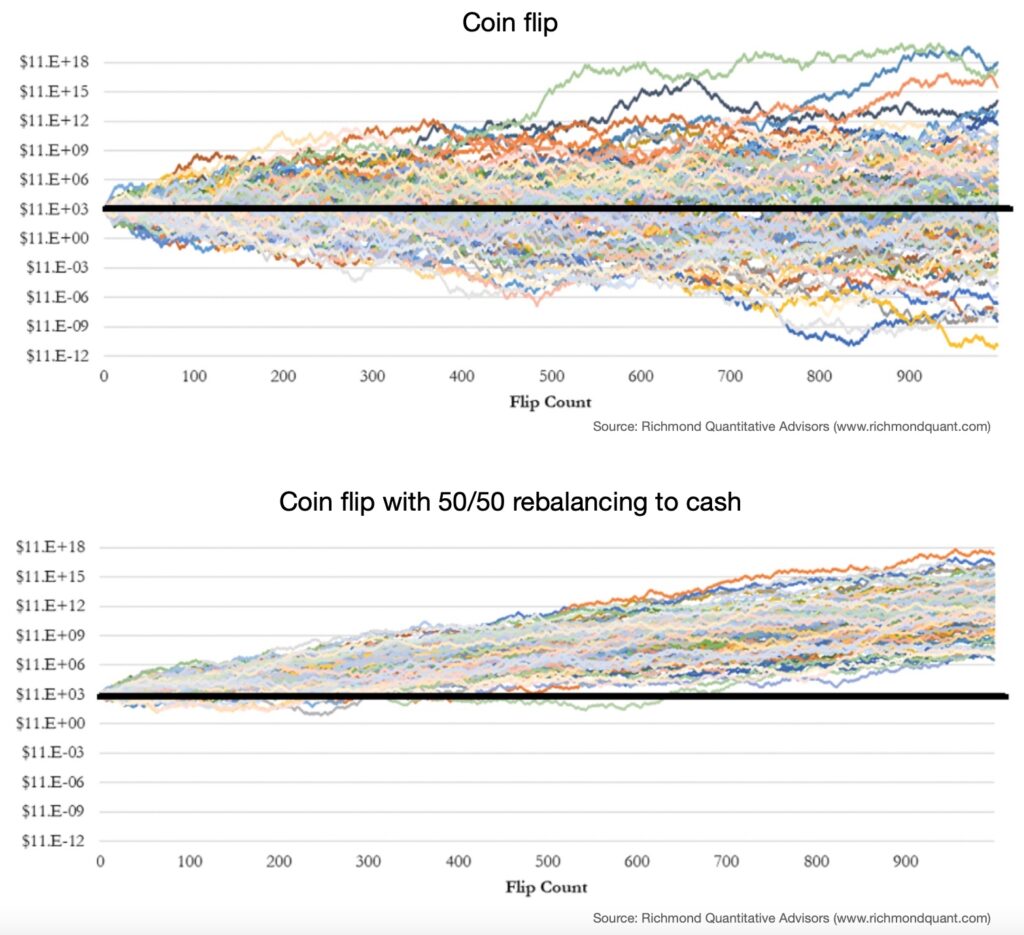
These examples show a perfect distribution of coin flips if the odds are 50/50, but we know that in real life we can have several heads or tails in a row. I found a Monte Carlo simulation done by Richmond Quantitative Advisors on their website, where they show that over a thousand simulation runs of a thousand coin flips each time, the concept maintains its edge. In the first graph below, the regular coin flip has some occurences positive and some negative, showing proof of the zero expectancy overall. The second graph below shows how the 50/50 rebalancing into cash makes all the simulation occurences end in positive territory.
Other sources on the web explained the concept by volatility drag, which means that by putting together two uncorrelated assets or strategies with zero expectancy (cash also has zero expectancy in absolute numbers) they mitigate downside volatility and contribute to upside return.
I think it works for two reasons:
1. Due to rebalancing, some profit is taken off the table after a win and cash is added after a loss, which positions capital more efficiently for the following bet.
2. Compounding comes into play because equity starts to change. When the outcome was fixed at $500, there was no compounding effect, but with growing capital it starts to play a role.
Putting it to work in SPX 0DTE options market
I have thought about this concept in my 0DTE options trading, where I can apply daily rebalancing to day-trading and therefore benefit from the daily compounding. I’ll show you what I mean with the following backtest.
It’s a day-trade strategy in SPX 0DTE options, which enters bull put and bear call vertical spreads throughout the day for net credit. The goal is to have these options expire out-the-money while managing risks in case the market moves against a position.
Up until May 2022, SPX had three weekly expiries (Mon, Wed, Fri), but then CBOE added Tuesdays and Thursdays, so since then we can trade 0DTEs every day of the week. The backtest includes all the days 0DTE was available. The period is January 2020 – August 2024.
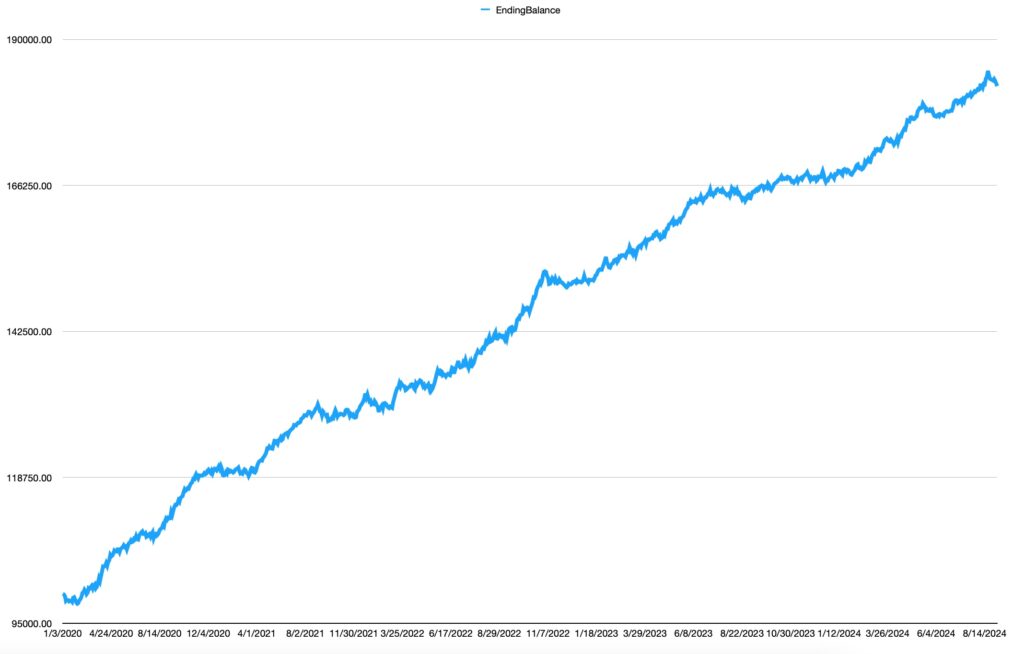
The first chart below shows the backtest with 1 SPX options contract, but still multiple entries throughout the day. Starting with $100k at the beginning of 2020, the account grew to $182k by the end of August 2024.
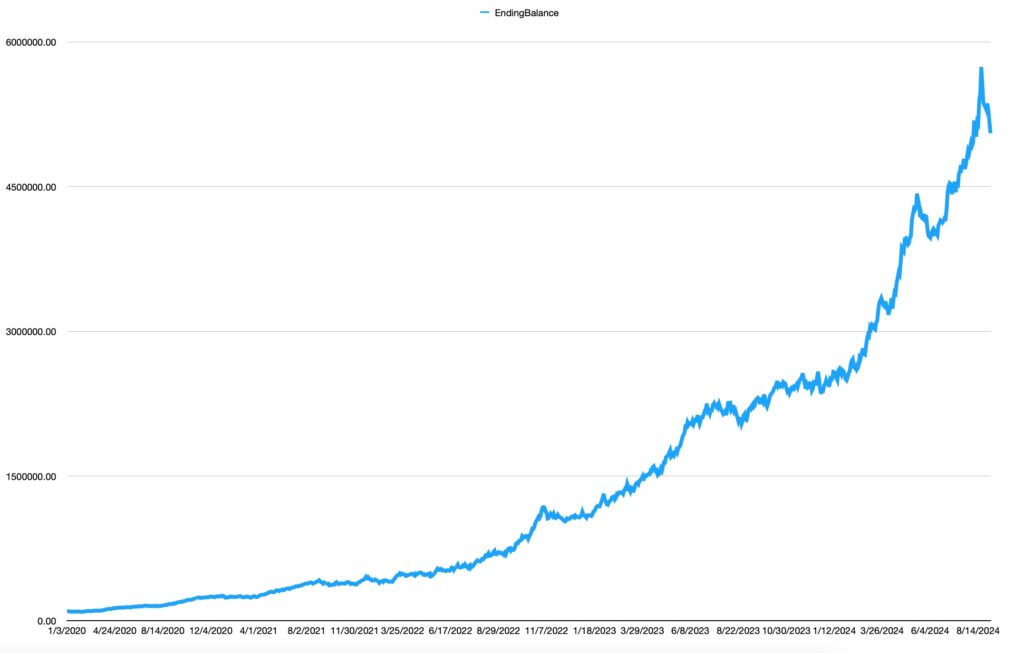
The next chart shows the exact same strategy with the same multiple entries throughout the day, but instead of a fixed 1 contract path it now uses 50% of buying power to add as many contracts as possible to compound the account along the way. It rebalances each day to use 50% of the account’s buying power at the start of a new session. $100k grew to over $5M with some violent drawdowns as you can see on the chart. It shows how compounding can work like magic if the strategy holds up and delivers. This is a backtest of course, but I’ve been trading this style for 2 years, without such aggressive sizing though. I can’t make the strategy public here, but the point of this exercise is to show how any decent trading strategy can work great with proper position sizing and rebalancing thanks to the compounding effect.
Real life trading is different
A backtest is just a simulation, where a set of rules have been applied to a dataset. In live trading, we need to deal with all kinds of issues like getting fills, slippage, software bugs, technical errors, losing power or the internet etc. Here’s an example of my recent shenanigans in the options market that cost me several thousand dollars, which hurt the strategy but was just a small scratch for the overall portfolio, further proving the importance of position sizing.
15 minutes into the close, I had one $3 buy order filled at $29 and another one at $14 while the underlying market itself didn’t move much and other correlated options markets (SPY, ES) were also quiet. This means my $300 trade got executed for $2900 and another for $1400 per contract, creating a total loss of several thousand dollars in price slippage in an options market that should be the most liquid in the world, trading over $500 billion in notional value daily. So what happened?! It seemed that market makers dropped liquidity and widened bid-ask spreads, which made prices shoot up like 1000% just for a second and it came back down in the same minute. For example, my $29 fill was off the price chart as the chart below shows that $20 was the highest price for that option.
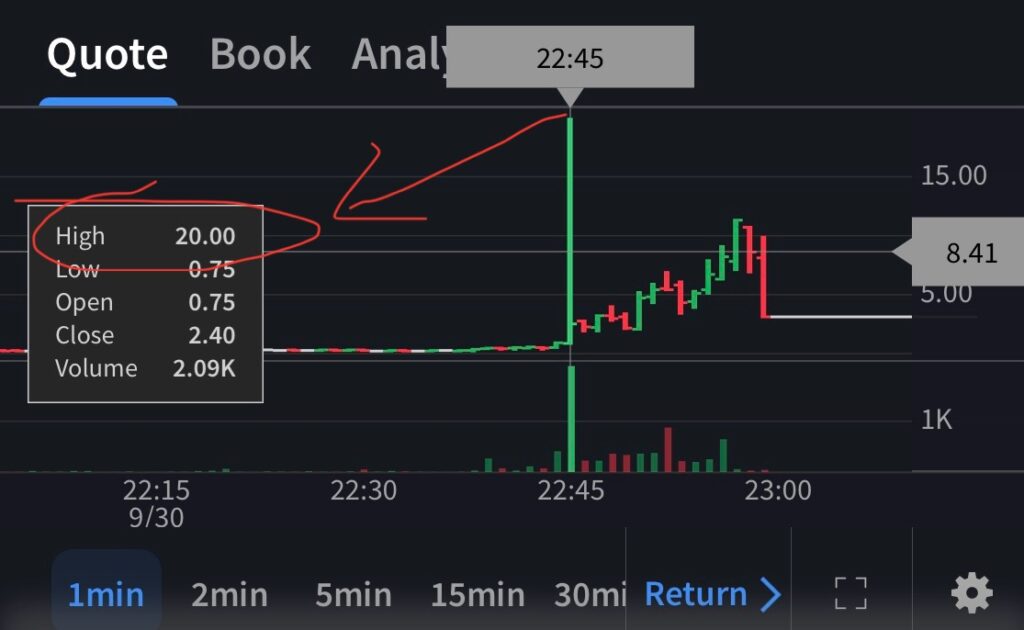
Anything can happen in the markets and I take responsibility for my trades. I did manage to fill a trade bust request at my broker in 29 minutes after the trade (the limit for 0DTE is 30min), which is meant to turn back erroneous fills that happen outside the fair market action, but the first response was negative. They are still investigating what happened that day and why my trade is off the chart, but from prior experience and talking to other traders, I don’t expect anything from it. This game is about extracting money from others. You are on your own. I will update the post if I do get a reply.
Having observed the stop triggering patterns over the past month with high slippages and prices off the charts while the market hasn’t moved a lot and correlated options markets like SPY and ES at other exchanges have been quiet, it’s clear that my money didn’t go to some retail punter at the other side of the trade but it went straight into CBOE’s market maker’s pocket. They control the SPX options market by widening bid-ask spreads and can influence prices to their liking, so this is something we need to accept and deal with as market speculators. The game is rigged but we can turn these created inefficiencies to our favor.
Update 12 Nov 2024: After 6 weeks of investigation, I got a reply from my broker saying that the trades were valid, they couldn’t review my trade bust request in time and they don’t have the obligation to do so.
Does Shannon’s Demon work on real markets?
The coin flip is a clean example because it goes nowhere: half heads, half tails, no trend. Real markets trend. So in September 2026 I tested the same rule on real prices: 50% in the asset and 50% in cash, rebalanced back to 50/50 at the close of every week. The cash earns nothing, like in the coin flip, and there are no costs or taxes. Prices are daily closes from Yahoo Finance.
Round trips: where the demon shows up
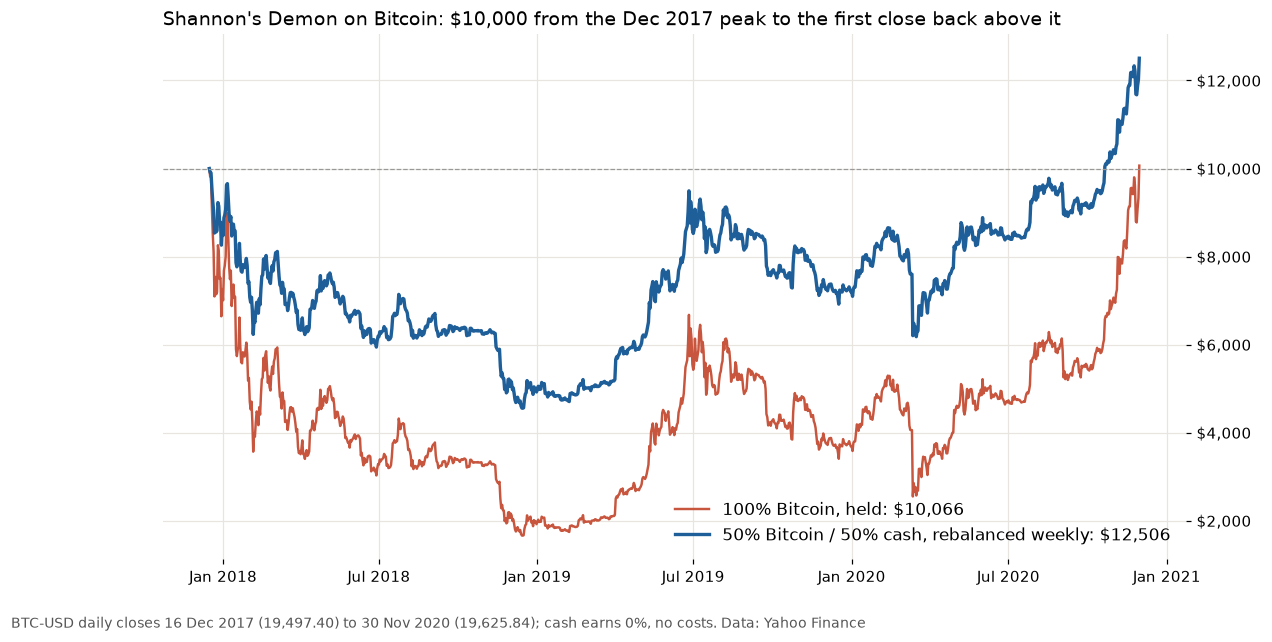
First the case that looks most like the coin flip: a market that goes down hard and comes back to exactly where it started. I took three such round trips, each from a peak close to the first close back above it: Bitcoin from 16 December 2017 to 30 November 2020, Bitcoin from 8 November 2021 to 4 March 2024, and the S&P 500 from 24 March 2000 to 30 May 2007.
| Round trip | Held | 50/50 |
|---|---|---|
| Bitcoin 2017–20 | +0.7% | +25.1% |
| Bitcoin 2021–24 | +1.1% | +10.0% |
| S&P 2000–07 | +0.2% | +2.5% |
That’s the demon. The price went nowhere, but the rebalanced account made money, because every week it sold a bit after a rise and bought a bit after a fall. The size of the bonus follows the size of the swings: Bitcoin’s wild three years gave 25%, the S&P 500’s seven years gave 2.5%. And the drawdown was cut by about a third or more each time: −83% held against −55% rebalanced in the first Bitcoin trip, −77% against −49% in the second, −49% against −28% in the S&P 500.
Over the whole history: holding wins
Now the same rule over the full data, where both markets went up a lot: Bitcoin from September 2014 and the S&P 500 from January 1970, both to September 2026. The worst drawdowns were −83% held against −55% rebalanced for Bitcoin, and −57% against −33% for the S&P 500.
| Per year | Held | 50/50 |
|---|---|---|
| Bitcoin 2014–26 | 54.3% | 31.4% |
| S&P 1970–26 | 8.1% | 4.3% |
In a market that trends up, rebalancing keeps selling the winner. That costs more than the volatility bonus brings in. $1 in Bitcoin became $184; the rebalanced 50/50 account became $27. Even a 50/50 split that was never rebalanced ended at $92. The S&P 500 numbers are price only, and cash at 0% is harsh on the 50/50 account: real cash paid interest in most of those years. It still wouldn’t have closed a gap that big.
What I take from it
The demon is real, but it isn’t free money. It’s a volatility harvest: it pays when a market swings a lot and goes nowhere, and it costs you when a market trends. On Bitcoin it would have turned the painful 2018–2020 round trip into a gain, and it would also have left most of the long-term rise on the table. What it does every time is cut the drawdown, which is the part I care about most (more on that in every trading strategy has drawdowns). If you’d rather hold Bitcoin through the swings, at least know how far below its long-term average it has already gone; I looked at that in the Bitcoin 200-week moving average post.
Not financial advice. This is educational content, shared for information and entertainment only, and it is not a recommendation to buy or sell any asset. Backtests and past results do not guarantee future results, and the numbers or charts here may contain mistakes. Trading carries risk, including losing all the money you put in. Do your own research before you make any decision.