Bitcoin’s 200-week moving average is at about $66,200: the average of the last 200 weekly closes, up to the week that ended on 4 October 2026. Bitcoin closed at $82,546 on 9 October, 25% above it. Since 2018 Bitcoin has spent 88% of all weeks above the line, but it has closed below it in 2020, 2022, 2023 and three times this summer. It is a zone where long-term buyers have done well, not a floor.
The 200-week line is the Bitcoin chart people share when the price has fallen and everyone wants to know how much further it can go. “Every cycle bottoms at the 200-week” is the usual claim. I wanted to see what the data actually says, so I took Bitcoin’s daily closes from Yahoo Finance (they start in September 2014), built weekly bars and put the 200-week average on them. The first week with a full 200 weeks of history is July 2018. From there to the start of October 2026 that is 430 weeks.
What is the 200-week moving average?
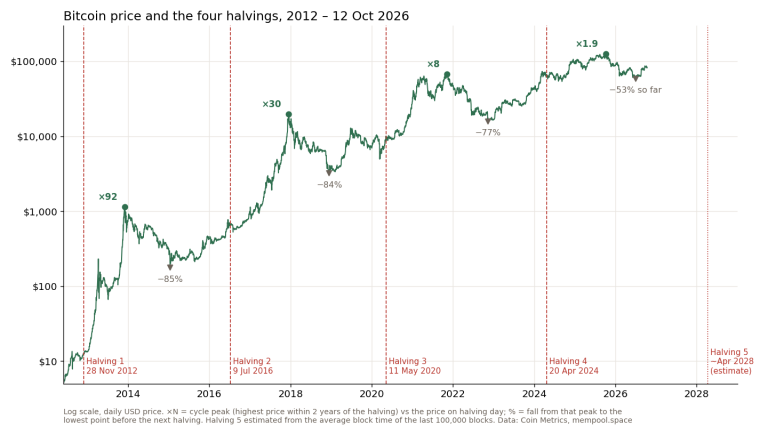
It is a simple average of the last 200 weekly closing prices. Every Sunday night a new week is added and the oldest one drops out. 200 weeks is about 3.8 years, which is close to the length of one Bitcoin halving cycle: the block reward halves every 210,000 blocks, roughly every four years, most recently in April 2024. So the line is roughly the average price of the last full cycle. That’s why it moves so slowly. It says nothing about next week and quite a lot about where the price has been.
A small warning before the numbers: different charts give slightly different values. Some sites use a different price index or close the week at a different hour, so you can see the same average a few hundred dollars apart. My numbers use Yahoo’s BTC-USD daily closes (UTC) and weeks from Monday to Sunday.
Where is Bitcoin’s 200-week moving average now?
After the week that ended on 4 October 2026 the average stood at $66,181. That week closed at $86,480, and Bitcoin closed at $82,546 on Friday 9 October. The line has been rising by about $350 a week lately, so it should be near $67,000 by late October.
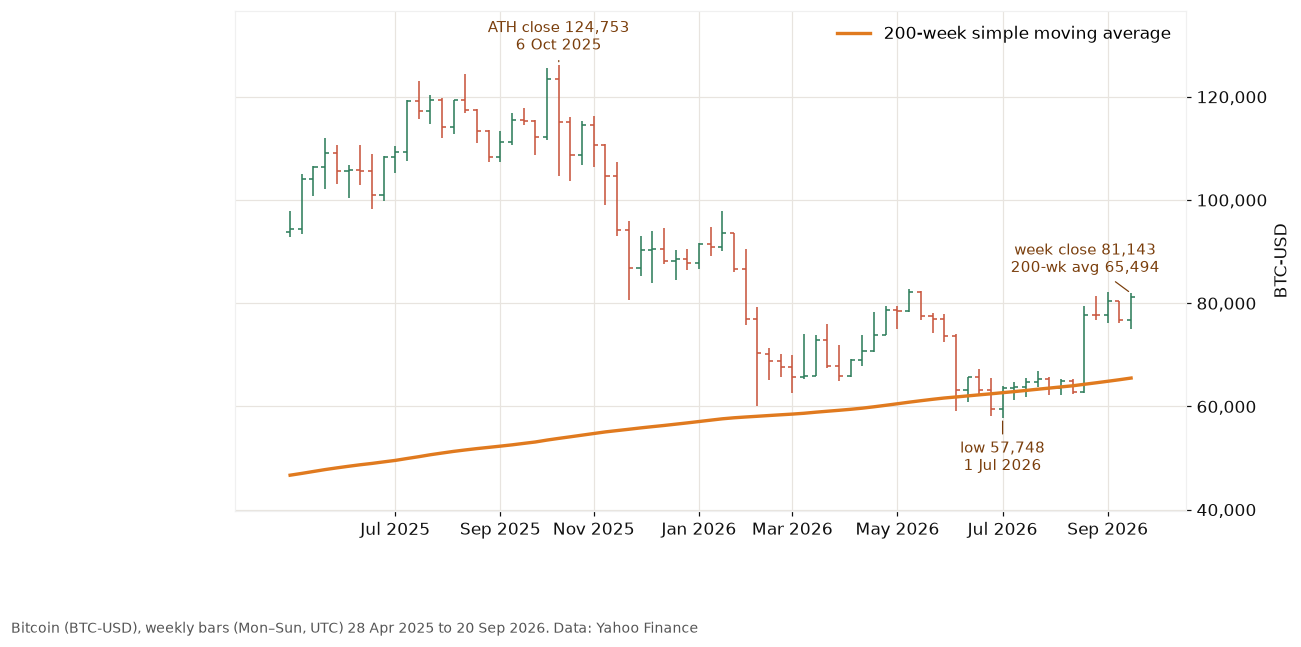
The last 12 months are a good lesson in why this line gets so much attention. Bitcoin’s highest close was $124,753 on 6 October 2025. From there it fell for months, and in June and July 2026 it was trading right on the 200-week average. The low was $57,748 on 1 July, about 8% under the line that week. It closed three separate weeks below the average (28 June, 2 August and 16 August), each time by less than 5%, and each time it was back above a week later. Then came the week to 23 August, when it went from $62,819 to $77,755. On 9 October 2026 it was about 34% below that October 2025 high.
Has Bitcoin ever closed below its 200-week moving average?
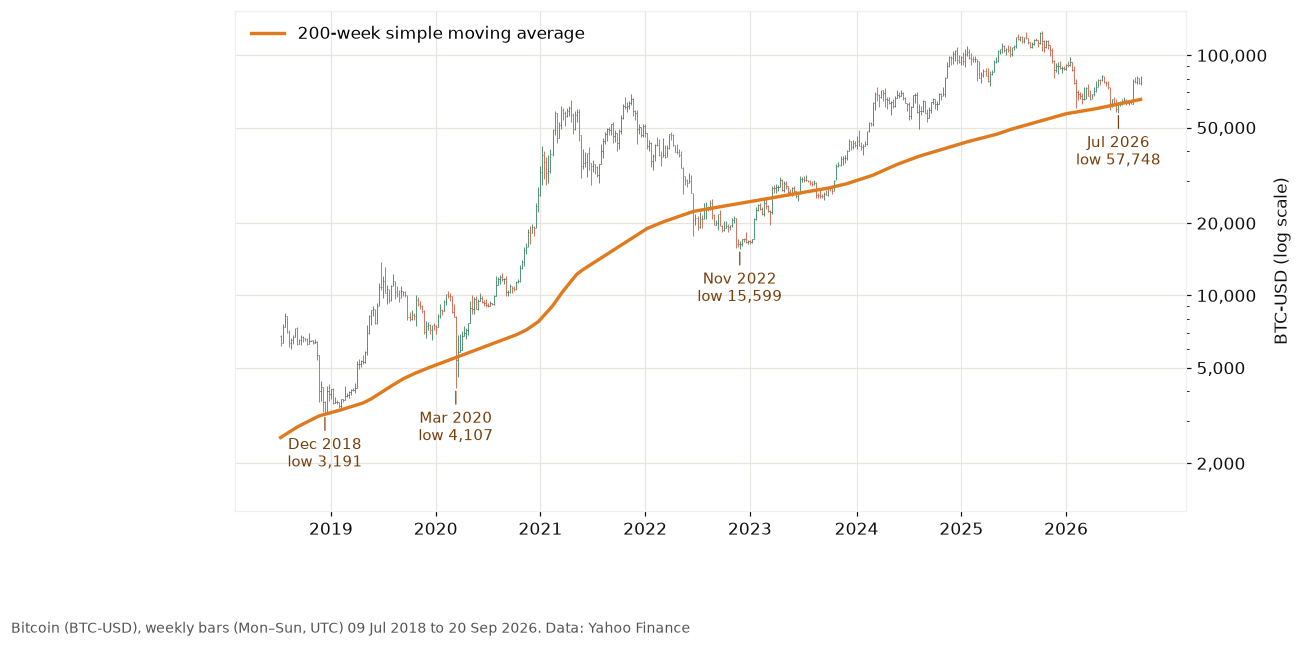
Yes, several times. Here is every stretch of weekly closes below the line since July 2018. The dates are the Sundays the weeks ended on. “Deepest” is the lowest weekly close against the line, and the last column compares the close 52 weeks after the first close below with that first close.
| Below the line | Deepest | A year on |
|---|---|---|
| 15 Mar 2020 (1 week) |
−2.5% | +1,000% |
| 19 Jun – 24 Jul 2022 (6 weeks) |
−14.3% | +28% |
| 21 Aug 2022 – 12 Mar 2023 (30 weeks) |
−32.2% | +22% |
| 11–18 Jun 2023 (2 weeks) |
−1.9% | +168% |
| 20 Aug – 24 Sep 2023 (6 weeks) |
−6.7% | +123% |
| 8–15 Oct 2023 (2 weeks) |
−3.6% | +125% |
| 28 Jun, 2 Aug, 16 Aug 2026 (3 weeks) |
−4.7% | not yet |
Two things in that table. First, most of these were short. The line was crossed, the next few weeks closed back above it, and a year later the price was much higher. In December 2018 Bitcoin didn’t even close below it: the low of that bear market was $3,191 on 15 December, and the average that week was $3,198. That was the month I wrote about Bitcoin being below $4,000. In March 2020 the low was $4,107 on 13 March, but the week closed only 2.5% under the line.
Second, 2022 broke the story. The first weekly close below the average was $20,553 on 19 June 2022. Anyone who bought that close as “the 200-week bottom” then watched Bitcoin close as low as $16,292, another 21% down, and trade at $15,599 on 21 November 2022, the month FTX collapsed. Bitcoin spent 30 weeks in a row under the line and closed as far as 32% below it. It still paid off a year later, but it was a long year.
Is the 200-week moving average a floor for Bitcoin?
No. It is a zone. In my data Bitcoin closed above it in 380 of 430 weeks, and every time it went under, it came back. That is a good record. But the sample is small: really three bear markets (2018, 2022 and this one) plus the Covid crash. And the one real crash in it, 2022, went a third below the line. Anyone who treats it as a hard floor should size their position as if the 2022 case can happen again.
The line has also never turned down in these eight years. Not a single week of falling average since 2018. That tells you more about the long-term trend than about where the next bottom is. If Bitcoin ever stayed low long enough for the 200-week average itself to roll over, it would be a different market from the one in this data.
How far above the line do the tops go?
The other side is interesting too. The biggest distance was in February 2021, when Bitcoin closed 518% above its 200-week average. At the November 2021 peak it was 277% above. The highest weekly close of 2024 was 146% above, and in the week of the October 2025 record it was 131% above. Each peak has stretched less far from the line than the one before. Four data points are not a law, but I would not assume the next top will stretch to almost four times the line just because 2021 did. Those stretched weeks are also when FOMO is loudest; what buying after a 20% week actually did is in FOMO trading.
200-week vs 200-day moving average
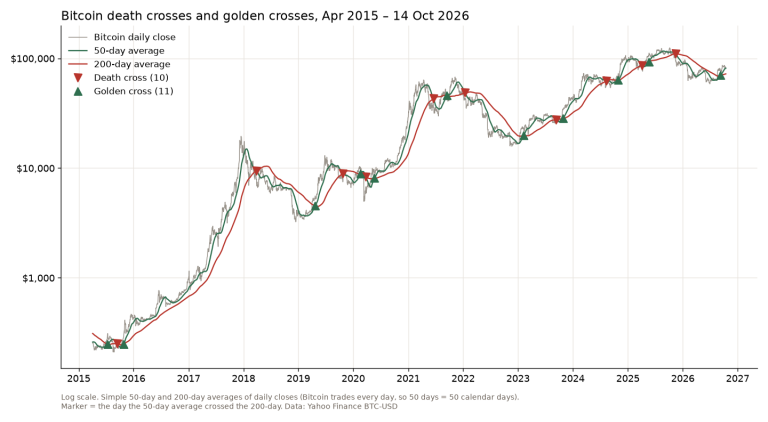
They do different jobs. The 200-day average is a trend filter for traders: above it, the trend is up; below it, you are more careful. I’ve used it on the Nasdaq 100 (QQQ) and it is the slow half of the golden cross test in the Setup Lab and of its bearish twin, the death cross. Bitcoin’s 200-day average was $71,856 on 9 October. Bitcoin closed below it on 3 November 2025, stayed under it for more than nine months, and closed back above it on 19 August 2026. At the 9 October close of $82,546 it was 14.9% above the 200-day line and 2.3% above the 50-day ($80,719). The 50-day itself crossed back above the 200-day on 8 September 2026, a golden cross, almost ten months after the death cross of 16 November 2025. Since 2015 Bitcoin has closed above its 200-day average on 61% of days, a lot less often than the 88% of weeks above the 200-week line.
The 200-week average moves far too slowly for timing trades. On Bitcoin it is more of a long-term reference point: how expensive is the price compared with the last four years? At 25% above, Bitcoin is on the cheap side of its own history since 2018 – the median distance over those 430 weeks was 67% – but “cheap compared with its own past” is not the same as “can’t fall further”. If you want the basics of how the different averages behave, Holly and Steve Burns’ Moving Averages 101 covers them well.
How I would use the 200-week line
Not as a buy signal on its own. As a place to ask a question: if I buy near the line, what happens if this is 2022? Then the plan has to survive another 30–35% drop before the line is reclaimed.
A worked example. Say I’m willing to lose $2,000 on a long-term Bitcoin position and I don’t want a stop that gets hit by a normal week. If I plan for a 35% drop from my entry, the position is $2,000 / 0.35 = about $5,700, not the $10,000 I might have had in mind. That is less exciting. It is also the only version where a 2022-style year doesn’t make me sell at the bottom. Long-term drawdowns come with every strategy; Bitcoin just makes them bigger.
FAQ
Why do people use 200 weeks and not 200 days on Bitcoin?
Because the 200-week average covers about one four-year halving cycle, so it smooths out the booms and busts inside a cycle. The 200-day average is shorter and reacts to the trend within a year. Both are simple moving averages; only the bar length is different.
Did Charlie Munger say to buy stocks at the 200-week moving average?
The line “if all you ever did was buy high-quality stocks on the 200-week moving average…” is shared everywhere with his name on it. I couldn’t find it in a primary source such as a speech, a shareholder letter or a meeting transcript, and none of the posts quoting it give one. I treat it as unsourced.
Is Bitcoin below its 200-week moving average now?
No. At the 9 October 2026 close of $82,546 it was 25% above the average of $66,181 (week ending 4 October). It was last below it on a weekly close in the week ending 16 August 2026.
The 200-week line is useful because it reminds you how far the price can swing inside one cycle. Just don’t read “it always came back” as “it can’t go lower”. In 2022 it went 32% lower first.
Not financial advice. This is educational content, shared for information and entertainment only, and it is not a recommendation to buy or sell any asset. Backtests and past results do not guarantee future results, and the numbers or charts here may contain mistakes. Trading carries risk, including losing all the money you put in. Do your own research before you make any decision.