Not that I hadn’t learned about it before, but getting more practice day by day, living through the ups and downs makes me realize even better why trading is hard. Professionals don’t just rake in profits, they also need to take risks that often result in expected losses along the way.
In fact, one’s trading account is in a drawdown most of the time which is the time of not making new equity highs. Sure, it’s usually in an insignificant range of only a single digit percentage, but it’s an inevitable process while participating in financial markets.
Usually half the expected drawdown will already make traders uncomfortable. When you say a 20% drawdown looks okay on paper, then in reality expect over 10% to create mental difficulties when following the system. If one can’t stomach a 20% drawdown the trading system shows in the backtest, then allocating less capital to it will make the total portfolio’s drawdown smaller at the time it happens for that particular strategy. Traders often say that your worst drawdown is yet to come, so be prepared. For example, it should not come as a surprise that “buy and hold” investors in the US market need to face 50% drawdowns for 10% average annual return.
With my fractional risk sizing it would statistically take 229 consecutive losses (initial stop loss getting hit) to bring my trading account down by 90%. If my system makes 50-100 trades per year it means the markets should go straight against me for 2-4 years for this to happen (swings and trends, long and short). That doesn’t mean I won’t have bumpy difficult times ahead, of course. There will be negative periods and deep drawdowns along the way, but I will be profitable in the next 100 trades thanks to my positive expectancy.
Possibly one of the reasons why it’s said that 90% of traders don’t have long term success is that they don’t know their strategy’s expected trade distribution (odds to win and lose), they don’t manage risk and bail on the strategy when the going gets rough, followed by beginner’s cycle of trying to find the holy grail that doesn’t exist.
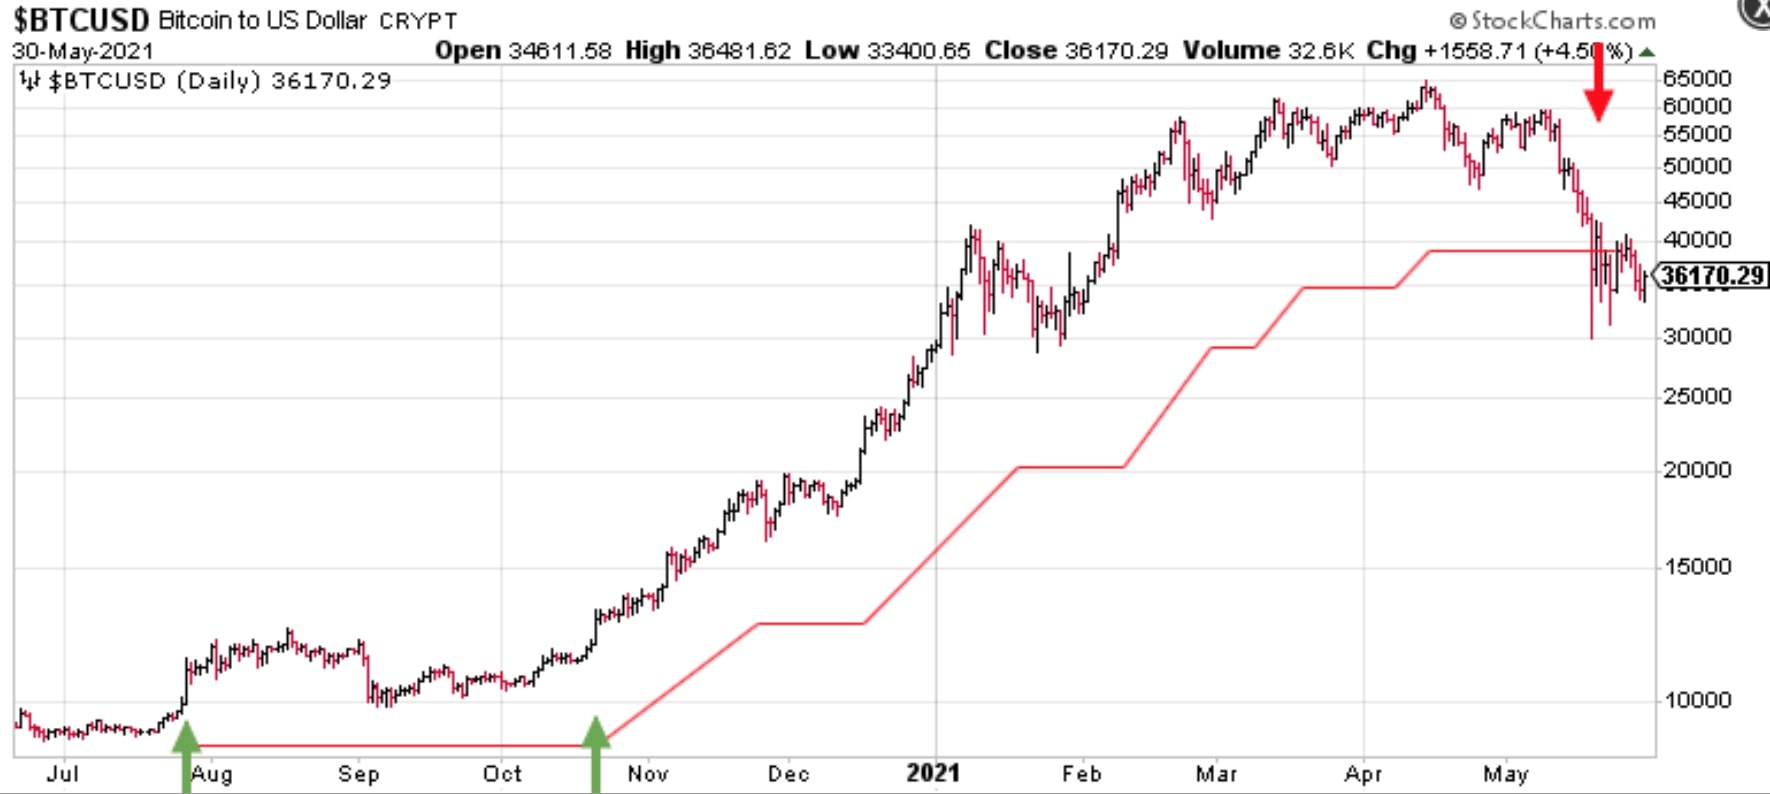
In May, Bitcoin took a hit and dragged down my overall performance because it had grown from 2% of my portfolio to 10%. This is the result of letting winners run and I don’t mind short-term pullbacks in my system’s performance. I still locked my BTC position for +210% gain, not too shabby for a 10-month hold. Such parabolic moves like Bitcoin had will have my trailing stop lag behind a lot, I know. But I haven’t found a better way to maximize long-term profitability of trends over a bigger sample size like 100 trades. Trying to pick a top in an uptrend would have got me out of BTC probably below $30k at the end of 2020 just to feel FOMO while standing on the sideline. So as we never know how far these trends can go, I prefer to stay on a trend as long as possible and give back some open profit in the end when it bends. The chart below shows how I was capturing the uptrend in Bitcoin (BTC), where green arrows show my entries, red arrow shows my exit and the red line is the trailing stop.
Many of my long stock positions also happened to pull back in May together with the overall US market. I went short in couple of stocks but they couldn’t offset all the drawdown from longs. Everything has been according to my expectations and I continue with my regular plan: cut losses short, let profits run.
Several months ago I posted an example of a trading strategy together with its drawdown chart. It’s now a good time to remind that even a good profitable trading system has expected drawdowns: Is trading art or science?
What is a drawdown in trading?
A drawdown is how far an account, a strategy or a market has fallen from its last peak, measured from that peak. If the account hit $50,000 and is now at $44,000, the drawdown is $6,000, or 12%. It stays a drawdown until the account makes a new high, however long that takes. That’s why I wrote above that an account is in a drawdown most of the time: the S&P 500 closed below its previous record high on about 91% of trading days from 2006 to September 2026.
Maximum drawdown is the largest peak-to-trough fall over a period: (trough value − peak value) / peak value. It’s the number to look at first in any backtest or fund report, because it’s the number that decides whether you’ll stick with the strategy.
Why a drawdown is harder to recover than it looks
The loss and the gain needed to get back are not the same size, because the recovery starts from a smaller base:
| Drawdown | Gain needed to recover |
|---|---|
| 10% | 11.1% |
| 20% | 25% |
| 33% | 49% |
| 50% | 100% |
This is the real reason to keep the risk per trade small. A 10% drawdown is a bad month; a 50% drawdown needs the account to double just to get back to where it was.
Maximum drawdowns of the S&P 500
The buy-and-hold drawdowns I mentioned above are not a figure of speech. These are the three deepest ones since 2007, on daily closes:
| Fall | Drawdown | New high |
|---|---|---|
| Oct 07–Mar 09 | −56.8% | Mar 2013 |
| Feb–Mar 2020 | −33.9% | Aug 2020 |
| Jan–Oct 2022 | −25.4% | Jan 2024 |
In index points that was 1,565 to 677 (October 2007 to March 2009), 3,386 to 2,237 (February to March 2020) and 4,797 to 3,577 (January to October 2022). The 2020 crash was the fastest of the three, down and back up again within six months. The 2007–09 bear market took five and a half years from peak to a new high. A trading system’s drawdowns work the same way. The difference is that position sizing lets me decide how big they are allowed to get.