RSI divergence is when price and the Relative Strength Index disagree: price makes a higher high while RSI makes a lower high (bearish), or price makes a lower low while RSI makes a higher low (bullish). It tells you momentum is fading. It does not tell you when, or whether, the trend turns. I tested the classic bearish version on 20 years of S&P 500 data, and on its own it was close to a coin flip.
That last sentence is the reason for this post. Most articles on RSI divergence show you three perfect examples where price rolled over right after the signal. Those examples exist. So do the others, and nobody screenshots those. I counted both.
What is RSI divergence?
RSI is J. Welles Wilder’s momentum oscillator from his 1978 book New Concepts in Technical Trading Systems. It compares the size of recent up closes with recent down closes and scales the result from 0 to 100. The default look-back is 14 periods, and Wilder treated readings above 70 as overbought and below 30 as oversold (StockCharts ChartSchool has the formula).
A divergence is simply a disagreement between two swing points on the price chart and the same two points on the RSI line. Price pushes to a new extreme, but the push has less force behind it than the previous one, so RSI doesn’t follow. Wilder saw that as a warning of a possible reversal. The same ChartSchool page also carries the caveat that matters most: in a strong trend, divergences are misleading, and an uptrend can print several bearish divergences before it actually tops.
Bullish vs bearish RSI divergence
- Bearish divergence: price makes a higher high, RSI makes a lower high. Momentum is fading on the way up.
- Bullish divergence: price makes a lower low, RSI makes a higher low. Selling pressure is fading on the way down.
- Hidden divergence: the reverse pattern, read as a sign the trend continues. Hidden bullish is a higher low in price with a lower low in RSI; hidden bearish is a lower high in price with a higher high in RSI.
The classic textbook setup adds one more condition: the first swing should come from an extreme reading. A bearish divergence starts with RSI above 70 at the first high, a bullish one with RSI below 30 at the first low. That is the version I tested.
Here is what a good one looks like. On 22 January 2020 the S&P 500 made a high of 3,338 with RSI at 73.1. On 19 February it made a higher high at 3,394 (the close that day, 3,386, was a record), but RSI only reached 65.6. A week later the index had fallen below 3,120 and by late March it was under 2,200.
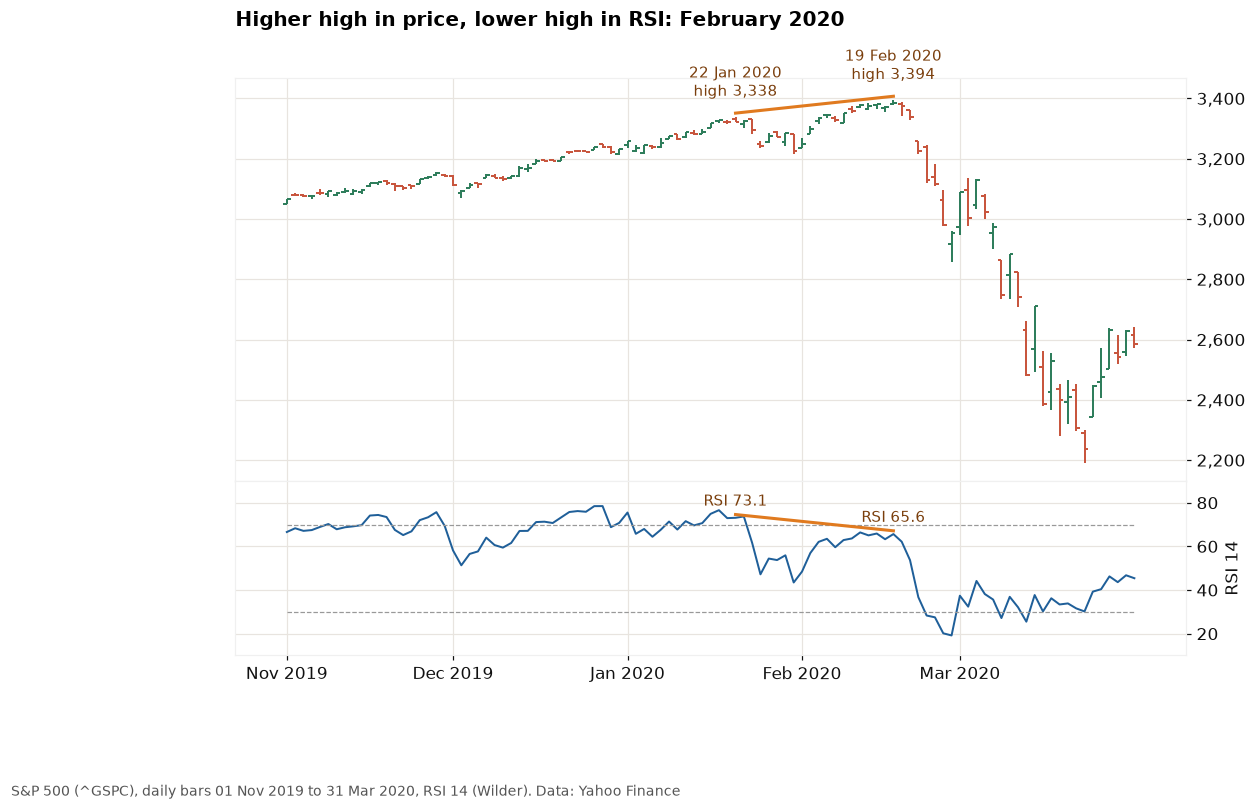
Charts like this one are what every divergence tutorial shows. It is also the biggest winner in my whole sample, which is exactly why charts like it get shown.
How accurate is RSI divergence? What 20 years of S&P 500 data say
I wanted a rule a computer can apply without hindsight, so the test is mechanical. The data is S&P 500 daily bars from 3 January 2006 to 25 September 2026, 5,215 sessions, with a 14-day Wilder RSI:
- A swing high is a bar whose high is the highest of the five bars on each side of it (a swing low, the same with lows).
- A bearish divergence is two consecutive swing highs 5 to 60 sessions apart, the second higher in price, RSI lower at the second, and RSI at 70 or above at the first.
- The signal only counts five sessions after the second high, because that is when you can know it was a swing high. No peeking.
- Then I measured what the index did over the next 20 sessions, about a month, and compared that with all days in the period.
| Next month | Signals | All days |
|---|---|---|
| Index higher | 50% | 66% |
| Median return | +0.1% | +1.4% |
| Average return | −1.4% | +0.8% |
| Dipped 5%+ | 27% | 21% |
| Dipped 8%+ | 18% | 10% |
So there is something there, just not what the tutorials promise. Half the time the market was higher a month later. The median signal did nothing. The average is negative only because of four big declines: May 2010, October 2018, and the two signals in early 2020. When the signal was right, it was right in a big way. When it was wrong, it was usually a shrug.
Two more things bother me more than the percentages. First, 22 signals in 20 years is a small sample; one more crash or one less would change the average a lot. Second, the two worst bear markets of the period, 2007–09 and 2022, began without a classic bearish RSI divergence under these rules. The signal missed the moves you’d most want to be warned about.
Dropping the “above 70” condition doesn’t help. Any bearish divergence, 70 signals, had an average 20-day return of +0.3% and the index was higher 64% of the time, almost the same as a random day. That’s noise.
The bullish side looked better: eight divergences from below 30, and the S&P 500 was higher 20 sessions later in seven of them, with an average gain of 4.5%. Eight is far too few to build anything on, and buying dips in an index that went up most of those 20 years flatters any long signal. I wouldn’t read more into it than “not useless”.
Why RSI divergence fails in strong trends
RSI measures the speed of the move, not its direction. A market can keep rising at a slower pace for months, and every slower leg prints a lower RSI high. That’s a divergence by definition, and it means nothing more than “the trend is getting calmer”. I wrote the same thing in my review of Adam Grimes’ The Art and Science of Technical Analysis: momentum divergences fail as often as they work, and a strong trend produces several failing ones.
November 2021 is a typical failure. The S&P 500 made a high of 4,718 on 5 November with RSI at 76.4, then a higher high of 4,744 on 22 November with RSI at 63.1. Textbook bearish divergence. The index did drop to about 4,495 by 3 December, but by the time the signal was confirmed on 30 November, most of that dip was already behind it. On 3 January 2022 the index closed at a new record, 4,797.
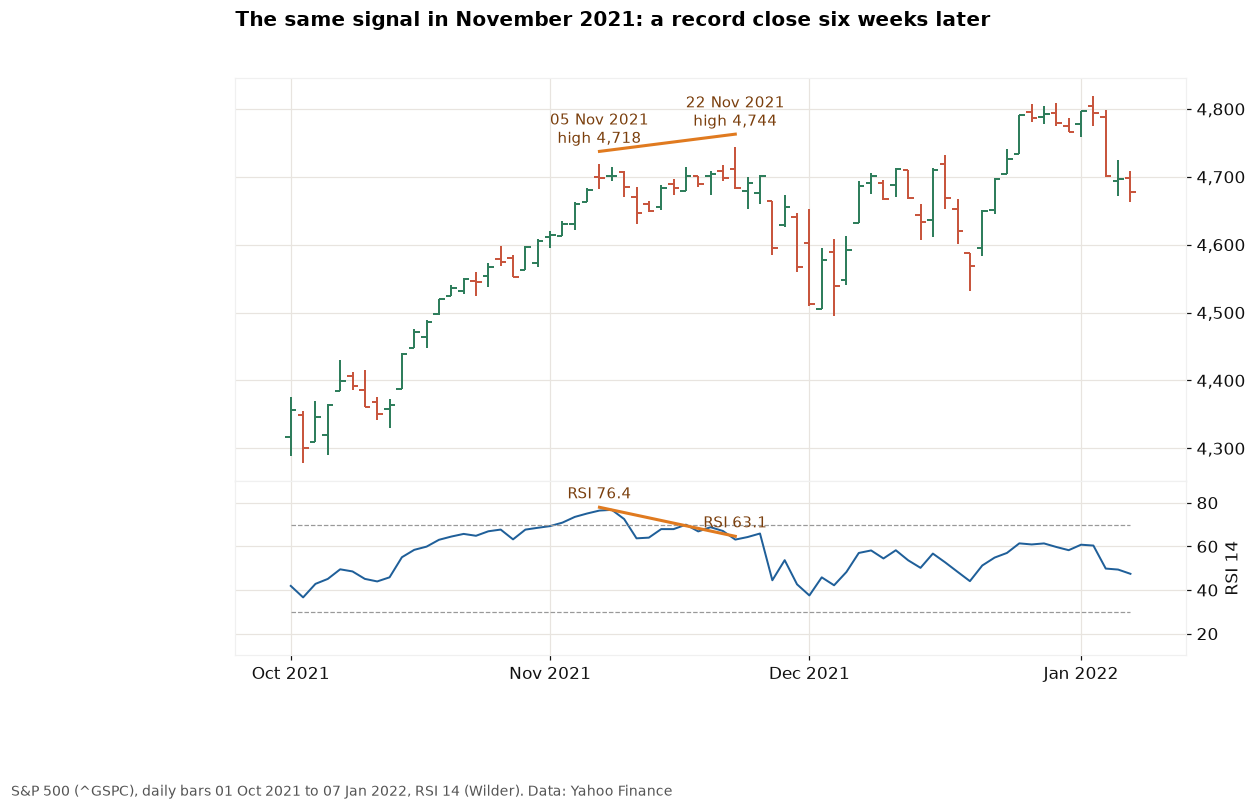
This is the other problem with divergences: they need two swings, and the second swing is only a swing after price has already turned down. By the time the pattern is complete, part of the move you hoped to catch is gone. If you trade them off a lower time frame to get in earlier, you get more signals, and more of them are noise.
How to trade RSI divergence without fooling yourself
I don’t trade divergence on its own. I use it as a reason to pay attention, and I let price give the actual signal. The way I would handle it:
- Treat it as a warning, not an entry. A bearish divergence tells me to stop adding to longs and tighten stops. It doesn’t tell me to short.
- Wait for price to confirm. A break of the last swing low between the two highs, or a close below a rising moving average, is the trigger. No break, no trade.
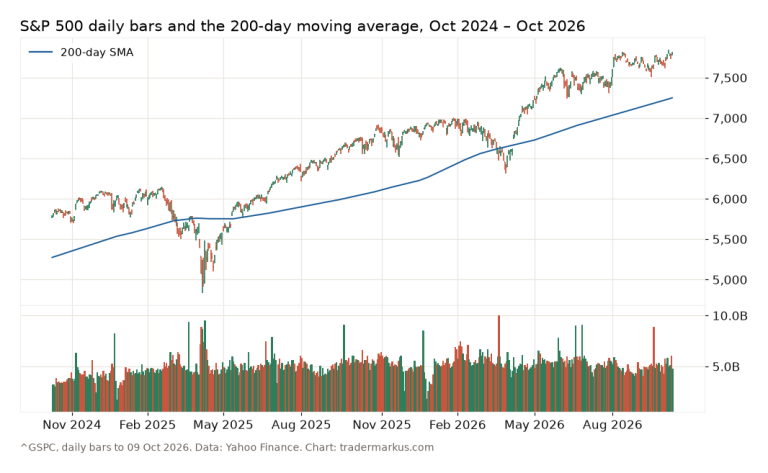
- Check the trend first. In my test, 21 of the 22 bearish divergences came with the index above a rising 200-day average. That’s simply where overbought readings happen, and it’s where a lower RSI high usually means a slower trend, not a top. Until price breaks, the trend gets the benefit of the doubt.
- Put the stop where the idea is wrong. For a short after a bearish divergence, above the second high. If price makes a third higher high, the divergence was just a slower trend. The stop loss trading guide covers where the stop goes and how to size the position from it.
- Size it like any other trade. A signal that works about half the time doesn’t deserve a bigger position than your normal risk.
Right now there isn’t one on the S&P 500 under the rules I tested, though it is close enough to show why the rules matter. The index made a record high of 7,844.52 on 6 October with the RSI at 62.3, lower than the 67.4 at the 13 August high of 7,816.70. That looks like a bearish divergence. But the August peak never reached 70, and the 22 September high sits between the two, so my test doesn’t count it. If you treat it as one anyway, the list above still applies: it is a warning, and the trigger is a break of the last swing low, not the RSI line. I mark the index’s support and resistance every Monday in the weekly levels, which is a more useful thing to watch than an oscillator.
FAQ
Is RSI divergence a good indicator?
It’s a good warning and a poor timing tool. In my test of 22 classic bearish divergences on the S&P 500 since 2006, the index was higher a month later half the time. It did precede some big drops, including February 2020, so it’s worth noticing. It isn’t worth trading alone.
What is the best RSI setting for divergence?
Wilder’s default of 14 is what most traders watch, which is a reason in itself to use it. Shorter settings like 7 or 9 print more swings and more divergences, and most of the extra ones are noise. Changing the setting until old charts look good is curve fitting.
Which time frame is best for RSI divergence?
Higher time frames give fewer but more meaningful signals. Daily and weekly divergences on an index show a real loss of momentum; a five-minute divergence often just shows lunch hour. Whatever the time frame, the trade still needs a price trigger and a stop.
What is the difference between regular and hidden divergence?
Regular divergence points to a possible reversal: price makes a new extreme and RSI doesn’t. Hidden divergence points to a continuation: in an uptrend price makes a higher low while RSI makes a lower low, which says the pullback was deep in momentum but shallow in price.
RSI divergence is worth knowing, and the charts in every tutorial are real. They’re just the winners. Count the losers too, let price confirm, and keep the stop where the idea is wrong.
Not financial advice. This is educational content, shared for information and entertainment only, and it is not a recommendation to buy or sell any asset. Backtests and past results do not guarantee future results, and the numbers or charts here may contain mistakes. Trading carries risk, including losing all the money you put in. Do your own research before you make any decision.