A fair value gap (FVG) is a three-candle pattern: the first candle’s high and the third candle’s low don’t overlap, and the empty space between them is the gap. ICT traders treat it as a magnet that price returns to. On 26 years of S&P 500 daily bars, gaps do get filled – 69% of bullish gaps within 20 trading days. But a zone the same distance from the price without any gap got filled just as often. The gap isn’t the magnet. The price wandering around is.
What is a fair value gap?
Take three daily candles in a row. In a bullish fair value gap the low of the third candle is higher than the high of the first one, so the middle candle moved so far that the two outer candles never traded at the same prices. A bearish gap is the mirror image: the third candle’s high is below the first candle’s low. That is the definition Capital.com and FluxCharts both use, and the term comes from the ICT (Inner Circle Trader) teaching. The idea behind the name is that price moved through those levels “unfairly”, with orders on one side only, so the market should come back to rebalance them.
The gap is not the same as a classic price gap between one close and the next open. The candles can overlap with the middle one; only the first and the third have to stay apart.
A fair value gap example on the S&P 500
A recent one. On 18 September 2026 the S&P 500’s high was 7,657.17. The next session rallied hard, and on 22 September the low was 7,756.26 – above that high. The gap between the two, 7,657.17 to 7,756.26, was about 1.3% of the price, large for an index. The textbook says price should come back into it, and it did: on 29 September the low was 7,653.55, which went through the bottom of the zone and filled it completely.
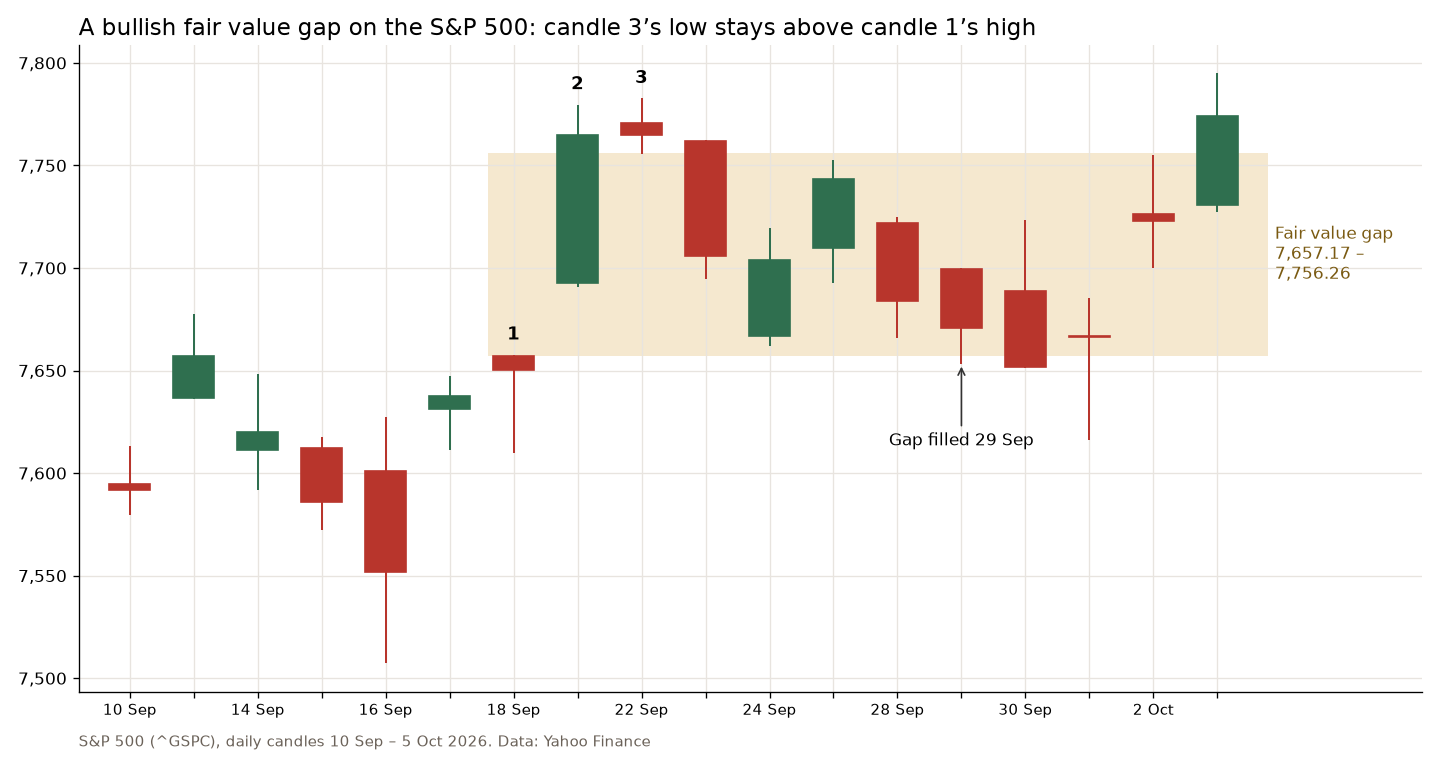
That is the kind of chart that makes the concept look like magic. One example proves nothing, though, so I counted all of them.
Do fair value gaps always get filled?
I went through every daily candle of the S&P 500 index from 3 January 2000 to 9 October 2026 (6,733 bars, Yahoo Finance data). I found 1,337 bullish gaps, about 50 a year, and 887 bearish ones, about 33 a year. The median gap was small: 0.42% of the price for bullish gaps, 0.50% for bearish ones. For each gap I checked when price first traded back into it (touched) and when it went through the far edge (filled). The table shows the share filled within 5 days, 20 days and ever.
| Gap | 5 days | 20 days | Ever |
|---|---|---|---|
| Bullish | 50% | 69% | 92% |
| Bearish | 60% | 82% | 100% |
So no, not always – but close. Every bearish gap since 2000 has been filled. 105 bullish gaps never were, and the oldest of them sit at the March and April 2009 lows. The S&P 500 simply never went back there. In a market that rises over time, gaps below the price can stay open forever and gaps above it get filled eventually.
The test that matters: a gap or any zone nearby?
High fill rates sound impressive until you ask what else gets filled. On a typical day since 2000 the S&P 500 traded in a range of about 1% from its high to its low. A zone half a percent away from the price is going to be hit a lot whether or not a pattern drew it there.
So for every gap I took a nearby day without a gap (up to 20 sessions earlier or later) and drew a zone at exactly the same distance from that day’s close, the same width as the real gap. Then I measured it the same way.
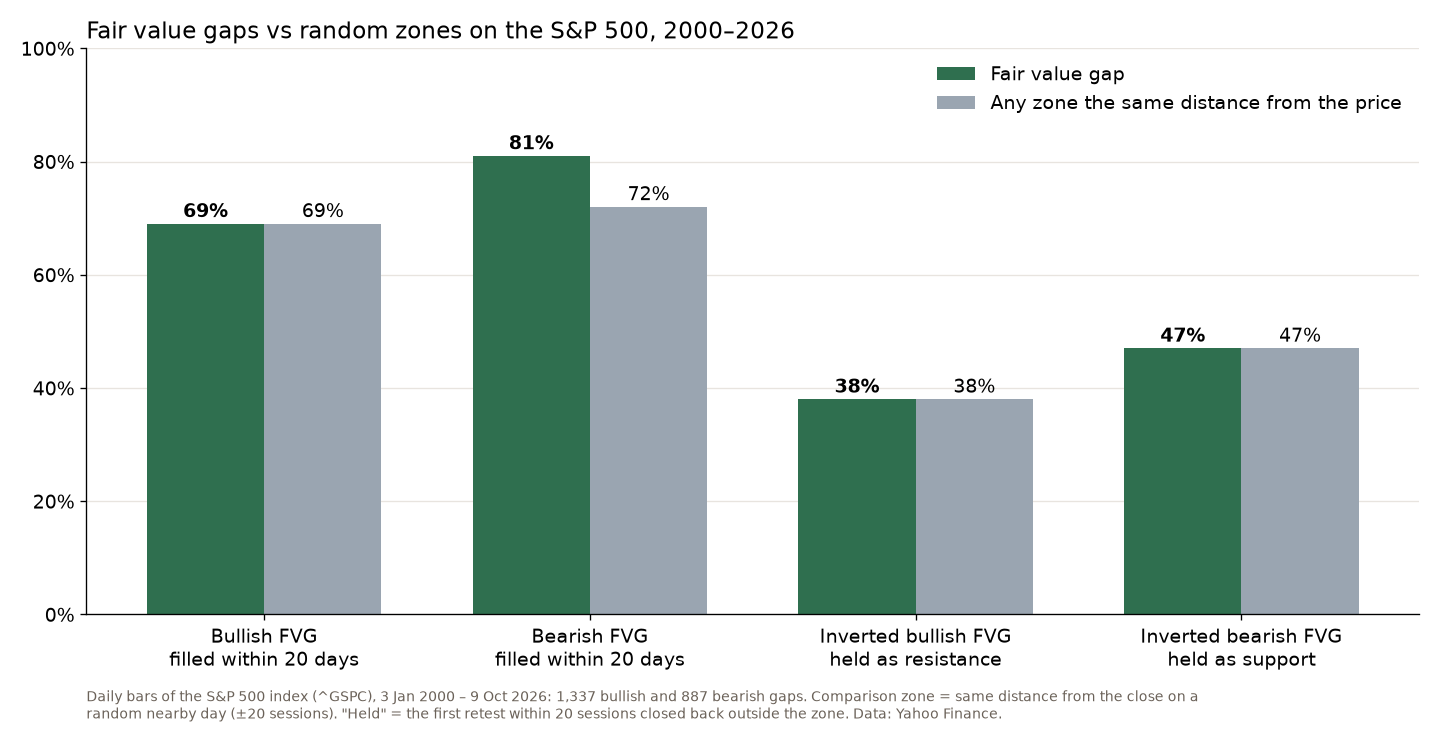
Bullish gaps were filled within 20 days 69% of the time. The random zones: also 69%. Within 60 days it was 80% against 79%. Nothing there. Bearish gaps did a bit better than chance – 81% filled within 20 days against 72% for the random zones (81% rather than 82% because the comparison leaves out the newest gaps, which don’t have 60 days of history yet). I wouldn’t call that FVG magic. A bearish gap appears after a sharp drop, and the S&P 500 has a long habit of bouncing after sharp drops. The bounce fills the gap; the gap doesn’t cause the bounce.
What is an inverse fair value gap?
An inverse fair value gap (IFVG) is a gap that failed. Price closes through it instead of bouncing, and the zone is supposed to flip sides: a broken bullish gap becomes resistance, a broken bearish gap becomes support. FTMO and LiteFinance both require a candle to close beyond the gap before it counts.
I tested that too. I took every gap where a daily close went past its far edge, waited for the first time price came back to the zone within 20 sessions, and checked whether that day closed back on the “right” side. Broken bullish gaps held as resistance on 38% of retests. Broken bearish gaps held as support on 47%. Random zones at the same distance: 38% and 47%. The same numbers to the percent.
Is FVG a good trading strategy?
Not on its own, at least not on daily S&P 500 charts. The gap tells you where price is likely to trade soon, but so does any level that close to the current price. That doesn’t make it useless. A gap marks where a fast move started, and if you are already long, the bottom of a bullish gap is a sensible place to think about a stop – I’d put it below the zone, not inside it. What I wouldn’t do is buy because price touched a gap, expecting it to hold. My VWAP test ended the same way: a level everyone watches barely changed the odds. And as the 200-day moving average study showed, the S&P 500 crosses nearby lines far more often than the headlines suggest.
On Friday, 9 October 2026, the S&P 500 had one bullish gap still open below the price: 7,684.75 (the 1 October high) to 7,727.59 (the 5 October low). The 8 October low of 7,731.26 came within four points of it. If the next pullback fills it, that will be a nice-looking chart – and, going by 26 years of data, about as meaningful as a coin landing heads.
FAQ
How do you identify a fair value gap?
Look at three candles in a row. Bullish: the third candle’s low is above the first candle’s high. Bearish: the third candle’s high is below the first candle’s low. The space between those two prices is the gap.
Which fair value gap is the strongest?
I didn’t split my test by gap size or timeframe, so I can’t rank them. What I can say is that on daily S&P 500 bars, gaps as a group didn’t beat a random zone at the same distance.
Do fair value gaps work on stocks and crypto?
The definition works on any chart. This test covers only the S&P 500 index on daily bars. A single stock or Bitcoin moves more, so its gaps are wider, but the same question applies: compare the fill rate with a random level at the same distance before trusting it.
A fair value gap is a good description of where price moved fast. It is not a prediction of where price must go. Mark it if it helps you read the chart, size the trade by the stop, and don’t pay for the magnet.
Not financial advice. This is educational content, shared for information and entertainment only, and it is not a recommendation to buy or sell any asset. Backtests and past results do not guarantee future results, and the numbers or charts here may contain mistakes. Trading carries risk, including losing all the money you put in. Do your own research before you make any decision.