VWAP, the volume-weighted average price, is the average price of the day weighted by how many shares traded at each price. It starts fresh at the open and shows where the bulk of today’s volume changed hands. I tested the most common rule built on it on SPY: being above VWAP an hour after the open barely changed the odds of a higher close – 56% versus 52% over 723 sessions, and the other way round in the last 60.
VWAP is one of the few indicators that day traders, big institutions and broker platforms all look at for the same reason. That makes it worth understanding properly. It also makes it easy to oversell. Below is what it is, how the number is calculated (with real SPY bars, not round numbers), how traders use it, and what happened when I checked the popular “above VWAP = bullish” read against the data.
What is VWAP in trading?
VWAP stands for volume-weighted average price. Take every trade of the day, multiply its price by its size, add it all up and divide by the total volume. A price where ten million shares traded counts ten times as much as a price where one million traded. The line starts at the open and resets every morning, so on a chart it begins next to the first bar and then moves more and more slowly as the day’s volume piles up behind it.
It came from the institutional side, not from chart traders. The term entered the literature in a 1988 Journal of Finance paper by Berkowitz, Logue and Noser, “The Total Cost of Transactions on the NYSE”, which measured how well institutional trades were executed by comparing each fill with the day’s VWAP. That is still its main job: a pension fund buying a big block wants its average price close to the day’s VWAP, and a broker who beats it did a good job (the Wikipedia entry has the history).
How VWAP is calculated
The formula is short: VWAP = sum of (price × volume) ÷ sum of volume, counted from the open. Real trade-by-trade data is expensive, so chart platforms use bars. For each bar they take a “typical price”, usually (high + low + close) ÷ 3, and weight it by the bar’s volume. Here are the first three 5-minute bars of SPY on 2 October 2026. The first bar had a high of 770.84, a low of 769.49 and a close of 770.70, so its typical price is 2,311.03 ÷ 3 = 770.34:
| Bar | Typical | Volume | VWAP |
|---|---|---|---|
| 9:30 | 770.34 | 3.30M | 770.34 |
| 9:35 | 770.77 | 0.86M | 770.43 |
| 9:40 | 771.18 | 0.59M | 770.53 |
After the first bar VWAP is simply that bar’s typical price, 770.34. The second bar’s typical price is 770.77, but it traded less than a third of the first bar’s volume, so VWAP only moves to 770.43. By 9:45 SPY was at 771.62 and VWAP was still at 770.53, more than a dollar behind. That is the whole personality of the line: heavy early volume anchors it, and it lags further as the day goes on. Your platform’s number can differ by a few cents from mine because it may use tick data or a different typical price.
How traders use VWAP
There are three common uses, and they are not equally useful.
1. A benchmark for your own fills
If you bought below the day’s VWAP, you paid less than the average buyer that day. For anyone working a larger order, or scaling into a position over a session, that is a fair way to grade the execution. It is the original use and the one that needs no prediction at all.
2. A bias filter: long above, short below
The popular rule: if price is above VWAP, buyers are in control, so only look for longs; below it, only shorts. Many day-trading books teach a version of this; VWAP is one of the eight setups in Andrew Aziz’s How to Day Trade for a Living. This is the claim I tested below.
3. Support and resistance
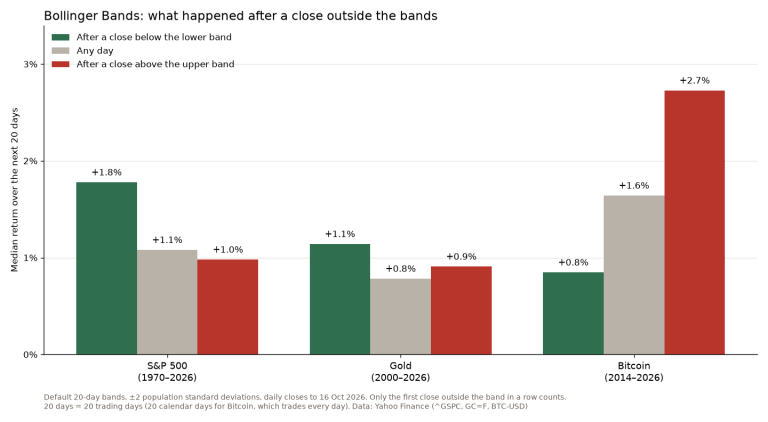
Traders buy pullbacks to VWAP in an uptrend and sell rallies into it in a downtrend. Platforms also draw bands around it: thinkorswim plots an upper and lower band a chosen number of standard deviations from VWAP as overbought and oversold levels. Bollinger Bands use the same idea around a 20-day average, and buying the lower band on gold won often and earned little in my Setup Lab test. Anchored VWAP is the same calculation started from a chosen bar, such as an earnings gap, instead of the open.
Is VWAP reliable? What the SPY data show
I took SPY 5-minute bars for the last 60 full sessions (10 July to 2 October 2026) and hourly bars for 723 sessions (3 November 2023 to 2 October 2026), both from Yahoo Finance, regular hours only. For every day I calculated VWAP the way described above and asked two simple questions.
Question 1: is SPY above VWAP at 10:30, an hour after the open, a reason to expect a higher close? Over 723 days, SPY was above VWAP at 10:30 on 393 days and closed higher than its 10:30 price on 222 of them, 56%. When it was below VWAP at 10:30 (330 days), it still closed higher on 172, 52%. All days together: 54.5%. So the “bullish” side came out two points better than a random day and the “bearish” side two points worse. In the last 60 sessions, with finer 5-minute bars, it was the other way round: above VWAP at 10:30 led to a higher close on 11 of 28 days (39%), below VWAP on 14 of 32 (44%).
Two points over three years is not nothing, but it is well inside what spread, commission and one bad fill eat. It is not an edge you can trade on its own. The 60-day sample flipping sign is a reminder of how noisy a rule like this is over a few months, which is about as long as most people test it by eye.
Question 2: does price respect the line? In the 60 sessions SPY crossed VWAP (5-minute close on the other side) a median of 6 times a day, and 3 or more times on 53 of the 60 days. The quietest day had no cross at all; the choppiest had 22. And it never strayed far: the median biggest distance from VWAP during a day was 0.35%, the largest 0.94%.
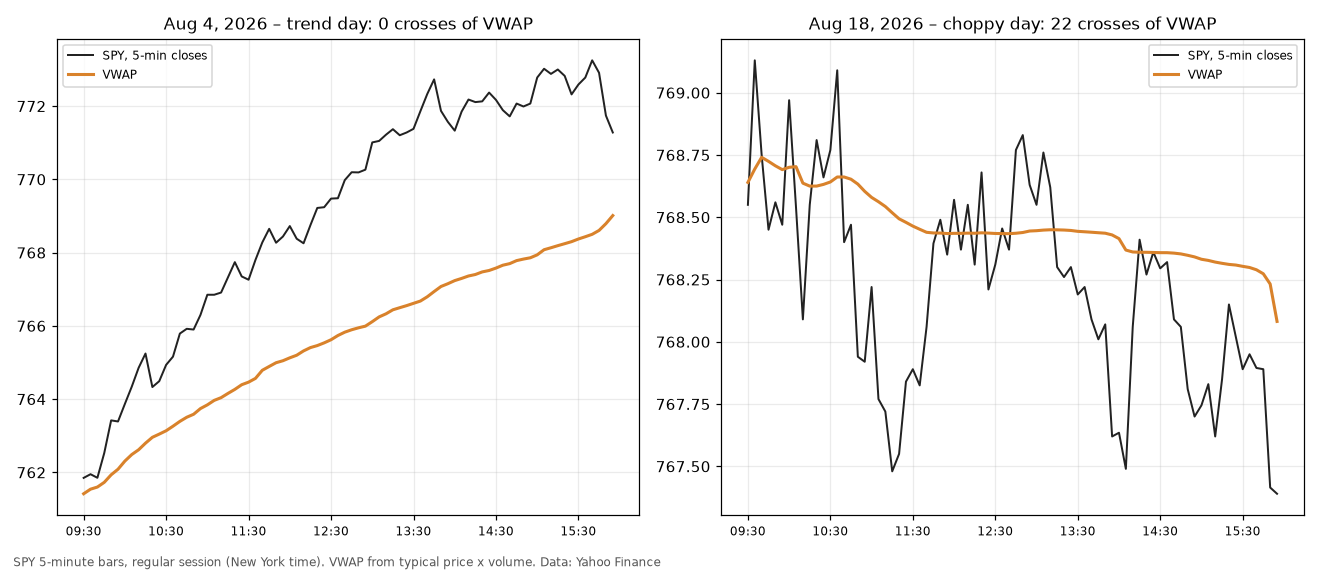
The chart shows the two extremes. On 4 August SPY opened at 760.63, never closed a 5-minute bar below VWAP and finished at 771.28, up 1.4%. That is the day the VWAP rule sells you on. On 18 August SPY went nowhere (768.70 to 767.39, with every 5-minute close inside a $1.74 band) and crossed VWAP 22 times. Every cross looked like a signal at the time. Note the scales: the closes on the left span $11.40, so the right panel is zoomed in more than six times.
How I would actually use VWAP
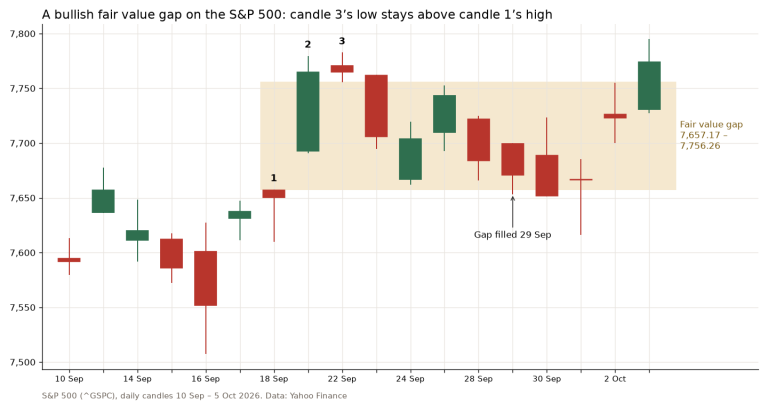
As context, not as a trigger. A stock that holds above VWAP after a gap tells you the gap buyers are not under water yet, and that matters if you are thinking of joining them. A pullback to VWAP on a trend day is a sensible place to look for an entry, because it gives you a level to put the stop behind. But the data say the line on its own does not predict the close, and on a choppy day it will flip you long and short all afternoon. Fair value gaps did no better in my S&P 500 test: bullish gaps got filled exactly as often as any zone the same distance from the price. If the stop is on the other side of VWAP, size the position so that being wrong is a normal, small loss; the arithmetic is in my post on stop loss placement.
VWAP also does nothing for a swing trader beyond the day it is drawn on. It resets every morning. For holding periods of weeks, the moving averages and the weekly chart do the job VWAP does intraday.
FAQ
What is a good VWAP setting for day trading?
Standard session VWAP has no length setting: it runs from the open to now and resets daily. The settings you can change are the bar size it is built from (1- and 5-minute are common), whether pre-market volume is included, and the width of the bands, if you use them. Use the same settings every day, or your levels will not be comparable from one day to the next.
Is VWAP better than a moving average?
It answers a different question. A moving average is the average close over a fixed number of bars. VWAP is the average price paid today, weighted by volume. Intraday, VWAP is the more meaningful number because large traders are measured against it. Across days, it is useless because it resets.
What does it mean when a stock is above VWAP?
That the last trade is higher than the average price paid so far today, so the average buyer of the day is in profit. It says something about the day so far. In my SPY test it said very little about how the day would end.
VWAP is a good ruler and a poor crystal ball. Use it to grade your fills and to find a sensible place for a stop. Don’t use it as a reason to trade.
Not financial advice. This is educational content, shared for information and entertainment only, and it is not a recommendation to buy or sell any asset. Backtests and past results do not guarantee future results, and the numbers or charts here may contain mistakes. Trading carries risk, including losing all the money you put in. Do your own research before you make any decision.