A trading journal template is a spreadsheet with one row per trade: entry, stop, target, size, exit, the result in dollars and in R, and a few honest notes on why you took it. You can download mine below as a free Excel file. It works out the risk, the R multiple and your statistics by itself, so the only work left is filling it in every time.
Most traders know they should keep a journal. Most stop after two weeks, usually right after the first bad week, which is exactly when the journal becomes useful. So I kept this one simple. Fifteen fields to type, five that calculate themselves, and one sheet that tells you the truth about your trading once a week.
Free trading journal template (Excel)
Download the trading journal template (.xlsx, free, no sign-up)
The file has four sheets. “How to use” is the short manual. “Journal” has room for 200 trades. “Stats” reads the journal and shows the numbers that matter. “Position size” tells you how many shares to buy before you enter. It only uses standard functions like IF, SUM, COUNTIF and AVERAGEIF, which LibreOffice, Apple Numbers and Google Sheets also have. In Google Sheets, use File → Import. The three example trades at the top are made up to show how the formulas work. Delete them before you start.
What should be in a trading journal?
Only what you will actually look at later. A journal with 40 columns looks professional and gets abandoned. Mine splits the fields into two groups: what you write before you click, and what you write after you are out. The “before” part is the important one, because it is written while you still don’t know how the trade ends.
Before the entry
- Date in, symbol, long or short.
- Setup: The name of the pattern or rule that made you take the trade, for example “pullback to the 50-day” or “breakout above last week’s high”. Use the same names every time, so you can sort by them later.
- Entry, stop and target: The chart sets the stop and the target. If you can’t fill in the stop, you don’t have a trade yet.
- Shares: From the position size sheet, not from a feeling.
- Feeling before entry: One word: calm, bored, impatient, angry after the last loss. This column looks silly for a month. Then it starts explaining your worst trades.
After the exit
- Date out, exit price and fees.
- Followed plan? (Y/N): Did you exit at the stop or the target, or did you improvise? Be strict. Moving a stop further away is an N.
- Mistake / note and lesson: One sentence each. “Held past the stop, hoping” is a perfectly good note.
The grey columns fill themselves: risk per share, dollar risk, planned reward-to-risk, P&L and the R multiple. Leave them alone.
Why the template measures everything in R
R is the money you planned to lose on a trade: the distance from entry to stop, times the number of shares. Van Tharp made this way of counting popular in Trade Your Way to Financial Freedom, first published in 1998. A trade that makes twice what you risked is +2R. A loss at your stop is −1R. Fees make it a little worse, which is why the example losses show −1.02R instead of an even −1R.
Dollars hide things. A $300 loss on a big position and a $300 loss on a small one look the same in the account, but one of them might have been a 3R disaster. In R, every trade is measured against your own plan, so a stock at $20 and an index future at 6,000 points become comparable. I wrote more about why the risk per trade should stay the same in Always use the same risk size, and about where the stop goes in Stop loss trading: Where to put the stop and how much to buy.
How to read the Stats sheet
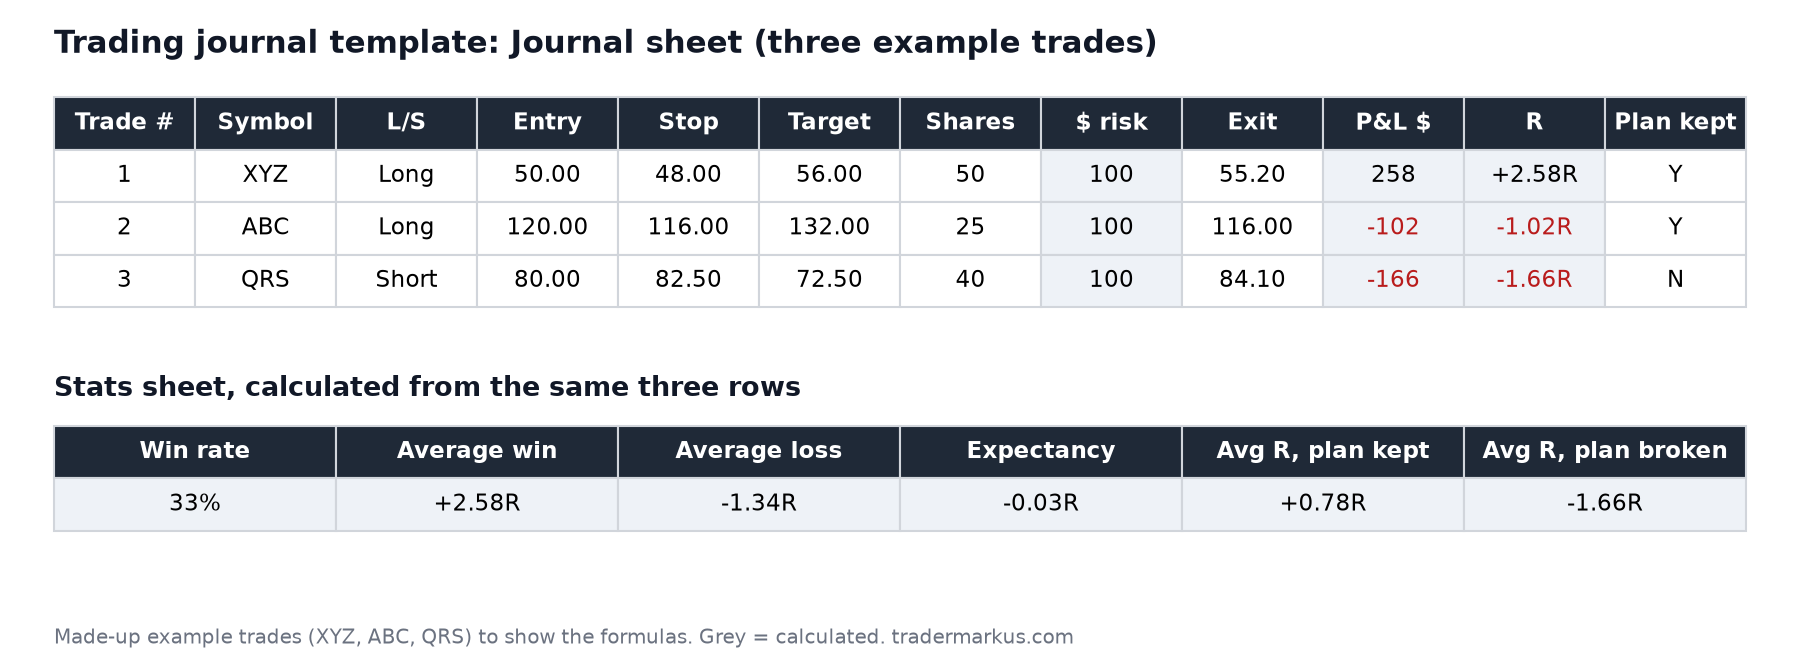
Here is what the three example trades produce. They are invented, but the arithmetic is real, and it shows the one thing a journal is best at.
| Trade | XYZ long |
ABC long |
QRS short |
|---|---|---|---|
| Entry | 50.00 | 120.00 | 80.00 |
| Stop | 48.00 | 116.00 | 82.50 |
| Exit | 55.20 | 116.00 | 84.10 |
| P&L | +$258 | −$102 | −$166 |
| R | +2.58 | −1.02 | −1.66 |
| Plan | Y | Y | N |
The positions were 50, 25 and 40 shares, so each trade risked $100, which is 1% of a $10,000 account. The win rate is 33%, the average win +2.58R, the average loss −1.34R. Expectancy, the average R per trade, comes out at −0.03R. In plain words: this little sample loses money. Over a year these are the numbers that matter: in my 2019 summary I measured my own trading by win rate, average win against average loss, and profit factor.
Now look at the last two rows of the Stats sheet. When the plan was kept, the average was +0.78R. When it was broken, −1.66R. The QRS short didn’t lose because the idea was bad. It lost because the stop at 82.50 was ignored and the trade was closed at 84.10. Had it been closed at the stop, it would have cost about $102 like the ABC trade, and the three trades together would show a profit of about $54 instead of a $10 loss. One trade where the rules were ignored turned a winning sample into a losing one. Without a journal, you would just remember “a bad week”.
That split, plan kept against plan broken, is the most useful number in the file. If the “broken” average is clearly worse than the “kept” average after 30 or 50 trades, your system is not the problem. You are. I say that kindly; it was true for me more often than I’d like.
How to use the position size sheet
Type in your account size, the percent you risk per trade, the entry and the stop. The sheet gives you the shares. The example: a $10,000 account, 1% risk = $100. Entry at 50.00, stop at 48.00, so the risk is $2 a share, and $100 / $2 = 50 shares, a $2,500 position. The share count is rounded down, so the loss at the stop never goes over your limit. Doing this before every entry is what keeps the losses in the journal near −1R.
Excel, Google Sheets or an app?
Use whatever you will open every day. Journal apps can import trades from your broker, which saves typing, and that is a real advantage if you trade often. The cost is that they make it easy to skip the “before” fields, and those are the ones that teach you something. A spreadsheet is free, works offline and belongs to you. If you trade a few times a week, the spreadsheet is enough. My own journal started as this blog in 2018, which is the least efficient spreadsheet ever invented, but it did make me write things down. One entry teaches you little. James Clear’s point in Atomic Habits fits a journal well: small habits are hard to notice day to day but add up over the long run.
FAQ
How do I make my own trading journal?
Start with one row per trade and these columns: date, symbol, direction, setup, entry, stop, target, shares, exit, P&L, R multiple, plan followed (Y/N) and a one-line note. Add a formula for R = P&L / (|entry − stop| × shares). Or download the template above, which already has it.
Is there a free trading journal template?
Yes, the Excel file on this page is free, with no sign-up. It has a journal for 200 trades, a statistics sheet and a position size calculator, and it uses only standard functions, so you can also import it into Google Sheets.
Can I create a trading journal in Excel?
Yes. Excel is a good fit because the useful numbers are simple formulas: COUNTIF for the win rate, AVERAGEIF for the average win and loss, AVERAGE for the expectancy, and AVERAGEIFS to compare trades where you followed your plan with trades where you didn’t.
How many trades before the journal tells me something?
Three trades tell you nothing, as the example above shows on purpose. With 30 trades you start to see patterns in setups and mistakes. With 100 you can begin to trust the expectancy. Before that, read the notes column more than the averages.
A journal won’t find you an edge. It shows you whether you have one and how often you get in its way. Fill in the row before you click, and the hard part is done. For more on why so many traders never find out, see Is day trading gambling? What the numbers actually say.
Not financial advice. This is educational content, shared for information and entertainment only, and it is not a recommendation to buy or sell any asset. Backtests and past results do not guarantee future results, and the numbers or charts here may contain mistakes. Trading carries risk, including losing all the money you put in. Do your own research before you make any decision.