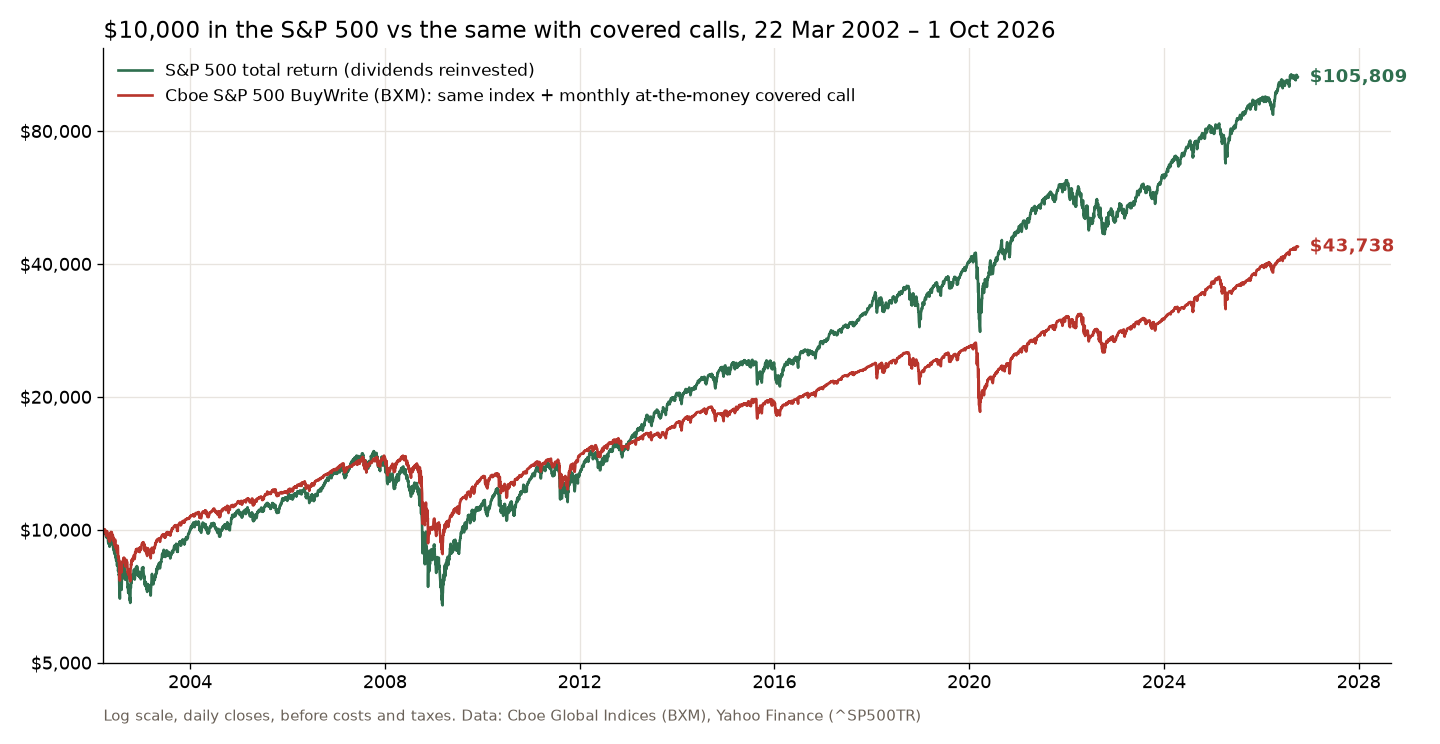
A covered call means you own 100 shares and sell someone the right to buy them from you at a fixed price, for a fee you keep. It turns some of a stock’s future upside into cash today. Cboe has tracked exactly this on the S&P 500 since 2002, and the result is clear: the covered call fell less in crashes, but $10,000 grew to $43,738 instead of $105,809.
Covered calls are sold as “income” or “getting paid while you wait”. The income is real. What gets mentioned less is the price you pay for it. So below are the mechanics with a worked example, and then 24 years of real data on what the strategy did against simply holding the index.
What is a covered call?
A covered call has two parts: you own the stock, and you sell a call option on that same stock. One option contract covers 100 shares. The buyer of the call pays you a premium now. In return, they get the right to buy your shares at the strike price until the option expires. It is “covered” because you already own the shares you might have to deliver. Selling a call without the shares is a naked call, and that is a very different animal.
At expiration there are two outcomes. If the stock is below the strike, the option expires, you keep the shares and the premium, and you can sell another call. If the stock is above the strike, you will most likely be assigned: your shares are sold at the strike price, and you keep the premium. Fidelity’s covered call explainer walks through the same steps.
A covered call example with round numbers
These are made-up round numbers to show the arithmetic, not a real quote. You own 100 shares of a stock at $100, so $10,000 in the position. You sell one call with a $105 strike that expires in a month, for $2.00 per share. That is $200 in your account today, whatever happens next. Here is the position at expiration:
| At expiry | Shares | Covered call |
|---|---|---|
| $90 | −$1,000 | −$800 |
| $98 | −$200 | $0 |
| $103 | +$300 | +$500 |
| $105 | +$500 | +$700 |
| $120 | +$2,000 | +$700 |
Read the table from the bottom. Above $105 the result stops moving: $500 from the stock up to the strike plus $200 of premium, $700 and not a cent more. That is the maximum profit. On the way down, the $200 only moves your breakeven from $100 to $98. Below that you lose almost the full drop, and if the stock goes to zero you lose $9,800. So the covered call caps your upside and keeps nearly all of your downside. That is the whole strategy in one sentence.
What 24 years of S&P 500 data say about covered calls
A single example tells you the shape. It doesn’t tell you whether the trade pays over years. For that there is the Cboe S&P 500 BuyWrite Index (BXM). Cboe describes it as a hypothetical portfolio that holds the S&P 500 and sells a succession of one-month, at-the-money S&P 500 calls (BXM factsheet). It is the plain covered call, run on the index every month with no opinions and no skipped months.
I compared Cboe’s daily BXM history with the S&P 500 total return index (dividends reinvested) from Yahoo Finance, from the first day in Cboe’s file, 22 March 2002, to 1 October 2026. Both are total return and both are before costs and taxes, so it is a fair fight.
| 2002–2026 | S&P 500 | BXM |
|---|---|---|
| End value | $105,809 | $43,738 |
| Per year | 10.1% | 6.2% |
| Volatility | 19.0% | 13.7% |
| Worst fall | −55.3% | −40.1% |
The covered call did what it promises. It was calmer, with about 28% less volatility, and its worst fall into 9 March 2009 was 40.1% against 55.3%. It also earned 3.9 percentage points a year less, and over 24 years that compounds into less than half the money. Cboe’s own factsheet, which goes back to 1986 with back-tested data before the 2002 launch, shows the same picture on monthly data: 8.6% a year for BXM against 11.2% for the S&P 500, with a worst drawdown of −35.8% against −50.9%.
When covered calls win and when they lose
Year by year, the covered call finished ahead of the index in 5 of 23 full calendar years from 2003 to 2025: 2007, 2008, 2011, 2015 and 2022. Those were weak or falling years for the index. In 2008 it lost 28.7% instead of 37.0%, and in 2022 it lost 11.4% instead of 18.1%. In every strong year it fell behind, often by a lot: 13.3% against 32.4% in 2013, 15.7% against 31.5% in 2019.
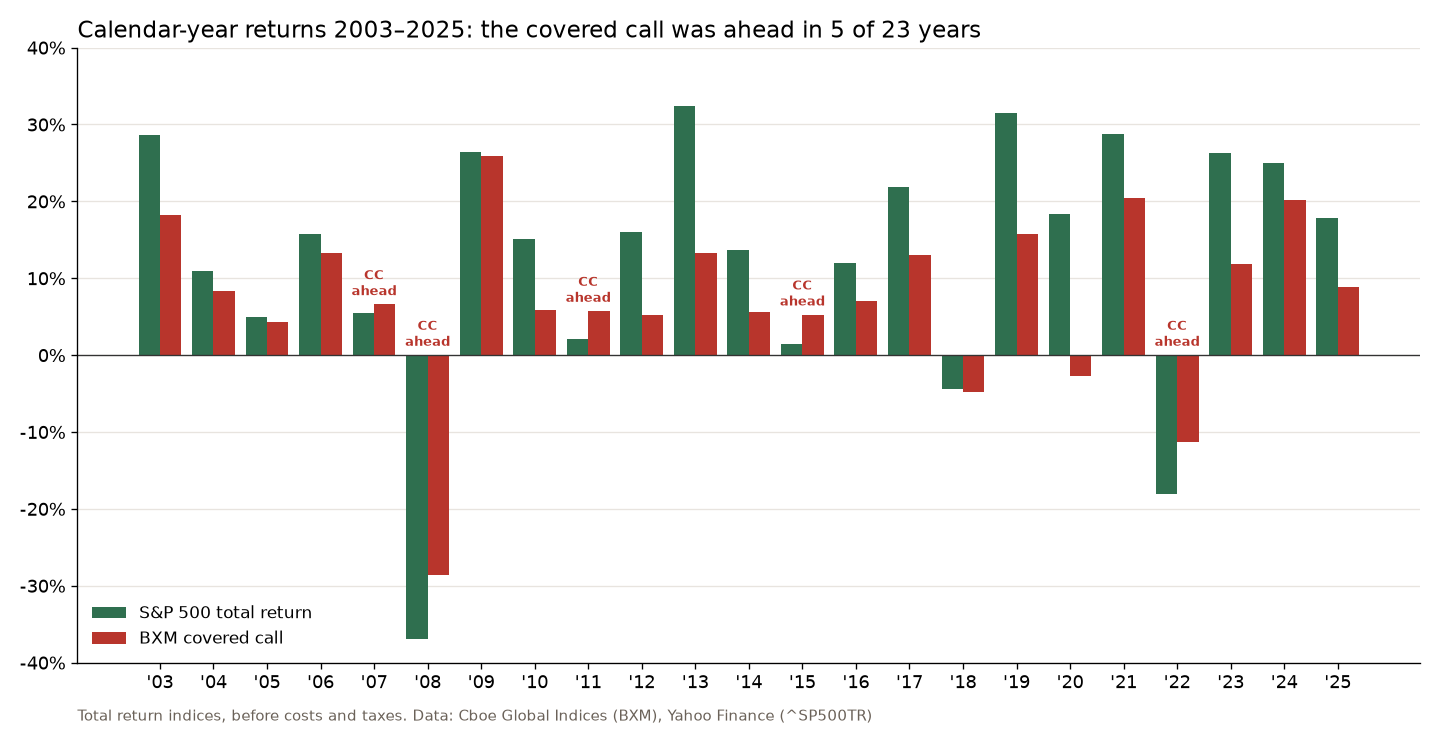
The year that shows the problem best is 2020. In the Covid crash the covered call fell 30.3% and the index 33.8%, so the premium cushioned the fall by only a few points. Then the market shot back up, and the calls sold every month capped each leg of the rebound. The S&P 500 total return index was back at its February high on 10 August 2020. The covered call needed until 22 March 2021. The calendar year ended at −2.8% for BXM and +18.4% for the index. In 2018 it even lost slightly more than the index, −4.8% against −4.4%. A cushion of a monthly premium is thin, and a fast drop goes straight through it.
Longer holding periods don’t fix it. Over every rolling five-year window in the data, about 4,900 of them, the covered call came out ahead only 19% of the time. This year, to 1 October, it is up 11.1% against 13.0% for the index. Capping the loss with bought options doesn’t fix it either: since Cboe launched its iron condor index in August 2015, it has earned less than T-bills.
Which S&P 500 covered call strategy did best?
BXM sells the call at the money, which gives away the most upside. Cboe also runs two versions that sell further out: BXY sells a one-month call 2% above the index, and BXMD sells the out-of-the-money call with a delta closest to 0.30 (Cboe methodology). Before their launch dates these indices are Cboe’s back-tests, so the fair comparison starts on 3 August 2015, when BXMD went live and all three were real. From then to 9 October 2026, with $10,000 at the start:
| Index | Per year | End value |
|---|---|---|
| S&P 500, held | 14.4% | $45,109 |
| BXMD, 30-delta | 10.2% | $29,700 |
| BXY, 2% above | 9.9% | $28,704 |
| BXM, ATM | 7.5% | $22,439 |
The further out the call, the better the result, and the closer it got to simply holding the index. None of them came close to the index itself, and the cushion in the 2020 crash was small: the worst falls were 30.3% for BXM, 31.4% for BXY and 32.3% for BXMD, against 33.8% for the index. In the ten calendar years from 2016 to 2025, all three trailed the S&P 500 in every year but 2022. Over the longer 2002–2026 window, which includes the back-tested years, the order is the same: 8.5% a year for BXMD, 8.2% for BXY and 6.2% for BXM, against 10.2% for the index. So the best S&P 500 covered call in this data is the one that sells the least upside, which says a lot about the strategy.
Why the covered call lags in a rising market
The reason is in the example table. The months when the market jumps are exactly the months you sold away. The premium is the market’s price for that upside. Some months it is too much, some months too little, but you are always short the best outcomes and long nearly all of the bad ones. That trade-off is fine when you understand it and want it. Just don’t count the premium as free money on top of the stock.
The same logic is why I am careful with the popular version of the idea: buy a volatile stock because its options pay a fat premium. The premium is fat because the market expects big moves, in both directions. You keep nearly all of the down moves and give away the up moves. That is how an “income” position turns into a stock you are holding at a loss with a small premium on top. If a stock doesn’t fit your plan without the call, the call doesn’t make it fit. A stop and a position size still matter, as in my post on where to put the stop and how much to buy.
When I think a covered call makes sense
I see two honest uses. The first: you already hold a stock you would be happy to sell at a higher price anyway. Selling a call at that price gets you paid to wait for it. If the shares get called away, you sold where you wanted to sell. The second: you expect a flat market and accept a lower long-run return in exchange for a smoother ride. The data backs that trade-off, as long as you don’t call it income.
Two practical points before anyone tries it. If the shares are called away, that is a sale, and in a taxable account a large unrealized gain can become a tax bill. And you need 100 shares for each contract, so a $500 stock ties up $50,000 for one call. A poor man’s covered call replaces the shares with a long-dated call to cut that cost, though on real SPY quotes it couldn’t pass its own setup rules. The mirror trade starts in cash instead of shares: a cash-secured put, which I tested the same way on Cboe’s put-writing index. If you want to go deeper on how option prices are built, Sheldon Natenberg’s book is the standard text, and my review of Option Volatility and Pricing says who it is for. For a lighter start, there is my Options 101 review.
FAQ
Can you lose money with covered calls?
Yes. The premium only lowers your breakeven by the amount you collected. If the stock falls further than that, you lose money, and if it goes to zero you lose the price you paid minus the premium. In 2008 the covered call index lost 28.7%.
What happens if the stock goes above the strike?
You will most likely be assigned and sell your shares at the strike price. You keep the premium and the gain up to the strike, but you miss everything above it. You can buy the call back before expiry to keep the shares, usually at a loss on the option.
Are covered calls a good strategy?
They swap upside for a smoother ride. On the S&P 500 from 2002 to 2026 the covered call was calmer and fell less, but it returned 6.2% a year against 10.1%. It suits someone who would sell at the strike anyway or expects a flat market.
Is covered call premium income?
It is cash in your account, but it is payment for giving up upside. Over 24 years the covered call index ended with less than half the money of the plain index. Calling the premium income without counting the upside you sold makes the strategy look better than it is.
The covered call is a good tool for selling a stock at a price you already like and a poor tool for getting rich. Sell the upside only when you don’t want it.
Not financial advice. This is educational content, shared for information and entertainment only, and it is not a recommendation to buy or sell any asset. Backtests and past results do not guarantee future results, and the numbers or charts here may contain mistakes. Trading carries risk, including losing all the money you put in. Do your own research before you make any decision.