I’ve been studying and trading options for the past several months. It’s not a style drift, but adding an uncorrelated income stream to the current systematic portfolio of stocks and futures. I have already read several blogs and papers about options, listened to over a hundred podcast episodes, backtested my own ideas and I’m currently trading short-term index options on SPX, also known as 0DTE weekly options (SPXW). I got this comprehensive book about options pricing and took notes while slowly studying it. I’m going to share my findings here in this review. The book was first published already back in 1988, but this is the second edition published in 2015.
I took some notes for myself that I can visually understand well when looking at the option chain in a trading software, but it’s often a good exercise to write things down:
1. Call option’s intrinsic value equals stock price subtracted by strike price, and put option’s intrinsic value equals strike price subtracted by stock price.
2. An option has intrinsic value if it’s in the money (ITM). An out-of-the-money (OTM) option has no intrinsic value, but only time value. Therefore, the intrinsic value of an option can’t be negative.
3. If the call option of a stock is ITM, the put option with the same strike of the stock can only be OTM, and vice versa.
4. If the strike price is equal to stock price, the option is at-the-money (ATM). These options are usually traded the most at the time.
5. The option’s trading price is the sum of intrinsic and time value, so the time value can be calculated by subtracting the intrinsic value from option’s price.
6. At the expiration, an option is worth only its intrinsic value, either zero if it’s OTM or the difference between the exercise price and underlying price if it’s ITM.
7. The option’s buyer has limited risk by the price paid, with unlimited potential gain; the option’s seller has unlimited potential risk, with limited gain by credit received. That being said, a put option has limited gain and limited risk in theory, because the price of a stock can’t fall below zero, but let’s stick to the practical side of buying and selling options in the context of trading, where one doesn’t wait for the stock to go to zero.
8. The most used Black-Scholes options pricing model looks at five characteristics: strike price, time remaining, current stock price, interest rate, volatility.
9. By knowing the strike price, stock price, interest rate, time to expiration and the current option price, we can then calculate the implied volatility that the market is considering at this moment.
10. Realized vol is calculated from price changes of the underlying asset, implied vol is based on the option price itself.
11. Change in volatility affects more further OTM options and more long-term options over short-term ones.
Some additional points I’ve studied about trading options that are important to understand:
– When trading options, always check the contract’s settlement conditions if it allows early assignment or only at the expiration (US vs European); if it’s cash or stock settled; and if it’s AM or PM settled meaning there could be a chance of overnight gap risk without being able to trade the position!
– Risk-first approach! Options are a highly leveraged instrument, therefore always check the notional value of a position and how much possible risk it introduces.
– Just like with trading stocks, options trading also comes with risk and reward hand in hand. Small wins are usually high probability trades while expecting large wins means generally low probability trades.
– When stock trading is associated with the direction of the market, then options trading also considers the speed of the move, meaning a trader needs to look at time and volatility.
– VIX is the volatility index from CBOE. It uses SPX weekly and monthly options of 23-37 days to expiration that expire on Fridays, to calculate the expected volatility of S&P 500 index for the following 30 days.
The book has a lot of content tied to options and futures, so it is a longer read to digest all the information. There’s more about interest rates, dividends and volatility in options pricing, standard deviation from the mean, probabilities of a +/- 1-3 standard deviation moves, normal distribution under low vol and high vol. The author explains risk management and topics about risk / reward.
I now understand even better the Greeks (delta, gamma, theta, vega and rho), but there’s also charm and vanna – measures of a measurement (delta). The book consists a lot of graphs and illustrations to better explain all the material and math about options. The author writes about strategies like strangle, straddle, condor, butterfly, spreads and others.
What the second edition covers
Option Volatility and Pricing first came out in 1988 and was revised in 1994. The second edition, published by McGraw-Hill, is the revised and expanded version I read. The publisher lists the main topics as the foundations of option theory, dynamic hedging, volatility and directional trading strategies, risk analysis, position management, stock index futures and options, and volatility contracts. McGraw-Hill also says that firms around the world often give it to new professional traders as their first book. There is a separate Option Volatility & Pricing Workbook with practice exercises, published in 2017, if you learn better by doing the math yourself.
Implied volatility in practice: the expected move
The idea from the book I use most is turning implied volatility into a price range. Implied volatility is quoted per year, so you scale it by the square root of time. Take a $100 stock with an implied volatility of 20%. One standard deviation over 30 calendar days is $100 × 0.20 × √(30/365), about $5.73. Over one day it is about $1.05. Under a normal distribution the stock would stay within ±$5.73 about 68% of the time and within twice that about 95% of the time.
The catch is that markets are not normal. I checked it on the S&P 500’s daily closes from January 1970 to 30 September 2026, 14,307 days, using one standard deviation for the whole period. A normal distribution expects about 39 days with a move bigger than 3 standard deviations. The index had 193. For moves bigger than 4 standard deviations it expects fewer than one; there were 82. At the same time there were fewer medium days than the bell curve predicts: 21% of days moved more than 1 standard deviation, against 32% expected. Quiet most of the time, then violent. That is why a short option position that wins week after week can give it all back in a day, and why I size option trades from the worst case, not from the expected move.
Implied vs realized volatility: how often is the VIX too high?
Point 10 in my notes is the difference between realized and implied volatility. The VIX is the market’s implied volatility for the S&P 500 over the next 30 days, so it can be checked against what the index then did. I took the VIX close on every trading day from 2 January 1990 to 24 September 2026, the last day with a full month of moves after it, and compared it with the S&P 500’s realized volatility over the next 21 trading days, which is about the same 30 calendar days. The data is Cboe’s VIX history and the index’s daily closes from Yahoo Finance.
The VIX was higher than the volatility that followed on 85.9% of the 9,246 days. The median VIX was 17.6 and the median realized volatility 12.9, so the typical gap was 4.7 points. It didn’t matter much where the VIX was:
| VIX | Days | VIX higher | Median gap, points |
|---|---|---|---|
| Under 15 | 2,961 | 86.3% | 3.6 |
| 15–20 | 2,861 | 87.3% | 5.0 |
| 20–30 | 2,688 | 83.9% | 6.1 |
| 30 and above | 736 | 86.0% | 8.7 |
That gap is what option sellers get paid for: on most days the market prices in more movement than it delivers. The other 14% of days are the cost of it, and they come in clusters. On 20 February 2020 the VIX closed at 15.6. Over the next 21 trading days the S&P 500 moved at an annualized 87.5% as the COVID crash hit. Misses like that, with realized volatility more than 10 points above what the VIX had priced, came in 14 different years since 1990, including 1998, 2008 and 2018. The latest started in March 2025. So implied volatility is usually too high, and the days it’s too low are the ones that decide whether selling options worked.
Not financial advice. This is educational content, shared for information and entertainment only, and it is not a recommendation to buy or sell any asset. Backtests and past results do not guarantee future results, and the numbers or charts here may contain mistakes. Trading carries risk, including losing all the money you put in. Do your own research before you make any decision.
Who is Sheldon Natenberg?
Sheldon Natenberg started trading in 1982 as an independent market maker in equity options at the Chicago Board Options Exchange. From 1985 to 2000 he traded commodity options as an independent floor trader at the Chicago Board of Trade. From 2000 to 2015 he was Director of Education at Chicago Trading Company, a proprietary derivatives trading firm, and he has taught option seminars at exchanges and trading firms around the world. So the book is written by someone who priced options for a living, and it reads that way: practical first, math second.
I’ve pointed out things that were important to me at the time of reading, something different might catch your attention based on the style of trading. Therefore, if wanting to understand volatility and options pricing, I definitely recommend to read and study the whole book. Either this book or another similar one, the theory of options pricing is a must read if you want to take options trading seriously.
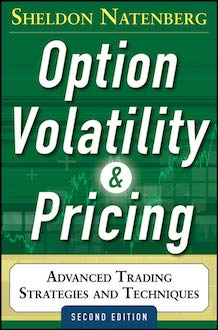
Affiliate link: as an Amazon Associate I earn from qualifying purchases. It doesn’t change the verdict.