Happy New Year!
The stock market is not a friendly place, where everyone is guaranteed to make money by having exposure in securities. It’s a highly competitive field, where the strongest survive. It’s a place, where dreams are crushed and hope can be lost. That’s why it takes mental fortitude and rigid risk management to survive, that is to preserve enough capital to be able to always come back to fight another day.
You can’t take risk without losing money
Drawdowns are an inevitable part of taking risk and surfing the odds in financial markets. Without drawdowns one would not be taking enough risk to make the most out of opportunities. Though it can be hard to experience a losing streak in a weak market environment, it’s a necessary part in trading. Drawdowns show that we have survived the markets and come back strong again. You don’t see drawdowns of traders, who blew up and never returned. As long as the drawdown is in an expected range and mathematically reasonable for a trading system, it’s nothing to feel bad for. I have never come across a trading strategy or a trader that makes over a single digit annual return and never loses money.
2022 results
I will unpack my 2022 results in this post. It was a weak year for me, but not too bad considering the overall market. I would’ve expected to stay in a single digit loss for a negative year, but we can’t decide what the market will do, and this time the peak was pretty much at the start of the year leading into a steady down grind for the whole 12 months. We’re always smarter after the fact, but this is not how risk-taking works.
My trading statistics
I had 935 trades. I didn’t sit in front of the screen to make all these trades. The number was much higher due to my new automated strategies. Positions from previous years that were open at the beginning of 2022 are in the stats with the open price of the year as the entry. This obviously drags down the numbers, because I had a profit giveback at the very beginning of 2022, when major long-term trends reversed and I got stopped out of several positions that were actually in profit from 2021.
- Win rate was 46%. This is actually in a normal range. In 2021, I had win rate 49%, when the overall return was 28%.
- Average win / loss ratio was 0,71. Since my long-term trend-following strategies were exiting positions in the first half of 2022 and the trend of the US stock market was down the whole year, the portfolio didn’t experience positive trends in stocks, and therefore losers were on average larger compared to winners.
- Profit factor was 0,59. If profit factor is below 1,00 it means I lost money. For every $ lost I made 59 cents. For example, my profit factor in 2021 was 3,6.
The equity curve of my portfolio with S&P 500 index
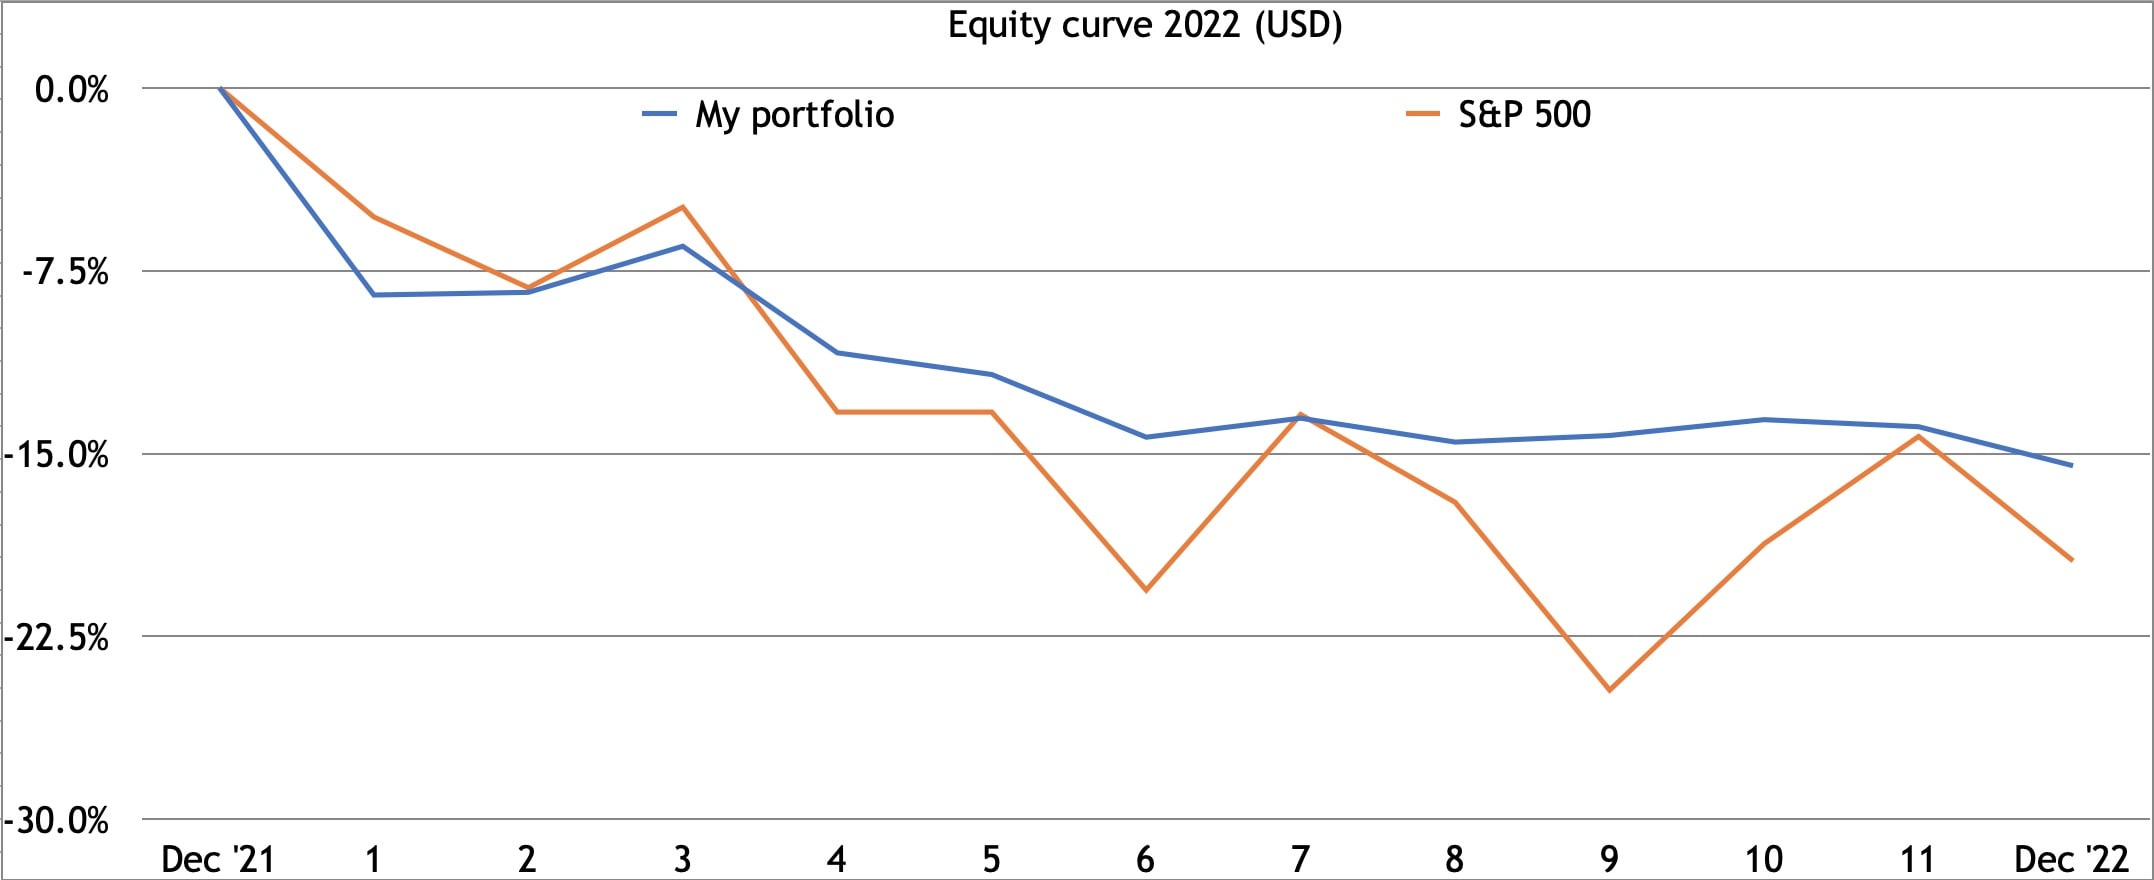
Here’s the equity curve of my whole portfolio in 2022 together with S&P 500 index. As you can see, it had a sharp fall in January, when long-term trends started to reverse and I got stopped out of several profitable positions that were overall great trades, but pulled the beginning year under water right off the bat. Then the portfolio had a bounce followed by another fall. In March, my trading system was already releasing risk significantly as it became more evident that the long-term uptrend was over. I was still swing trading, which didn’t work out well, but the portfolio was in a risk-off mode most of the second half of the year, showing a soft sideways grind in the equity curve.

The year of 2022 ended for a -15.5% loss in USD (-11% in EUR). S&P 500 index ended the year for a -19.5% loss (USD).
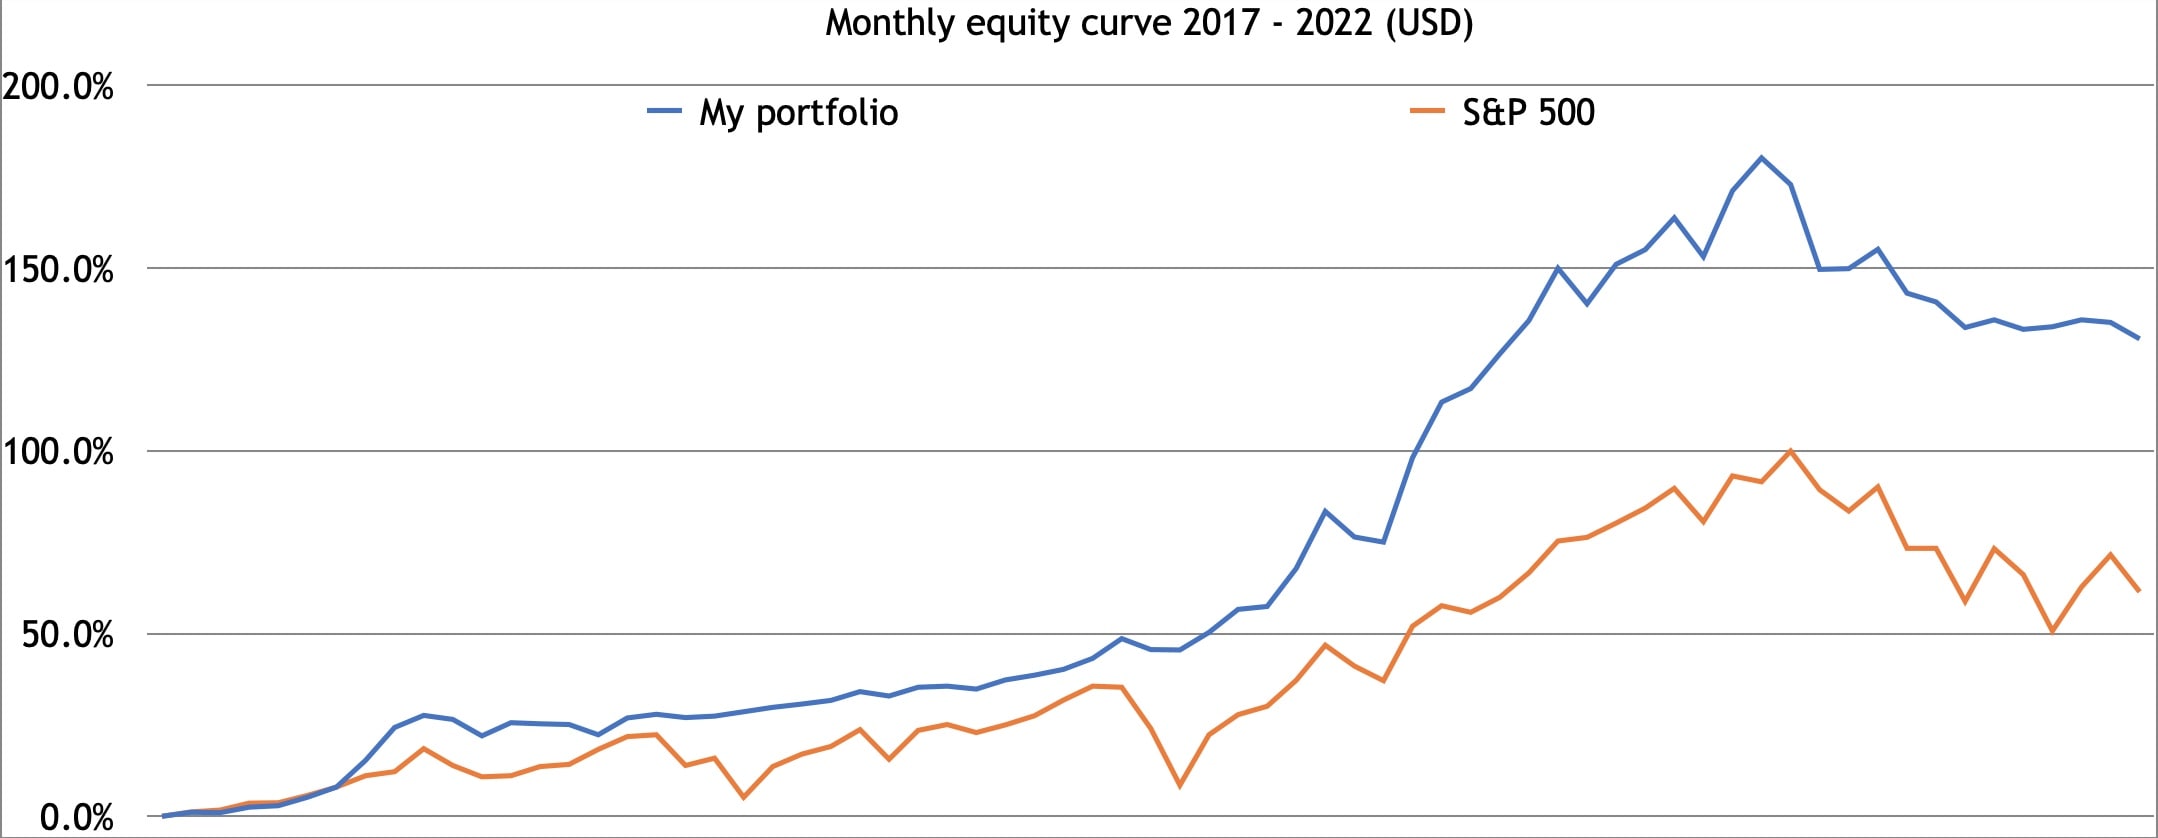
Now here’s the monthly equity curve showing all of my trading since 2017, the learning curve without cherry-picking an account or trades, no historical backtesting, but only what I’ve done in the markets trading my own money. And I know it’s getting better every year with experience and knowledge.

I don’t compare myself to the benchmark to find excuses or soften my drawdown, I should be able to do much better than the market average. And it has been the case for the past 6 years of being in the market. But I still find it a good illustration to note the volatility and drawdowns in the index. Most people look at the absolute return only, but holding the S&P 500 index is mathematically one of the worst risk-adjusted returns anyone could possibly want. I trade to grow my assets on a risk-adjusted basis with the benefit of compounding and I trade for short-term income, but holding the index ETF would not help me with any of this, considering the past 200 years and the fact that the future is always unknown.
I’m satisfied with all the research and development I did in 2022. Drawdowns are inevitable, but I know that if I keep pushing the buttons and let my trading system play out, then the portfolio will come back strong, because it’s based on math and probabilities, not hope and desires. To next 1000 trades!
Share this post