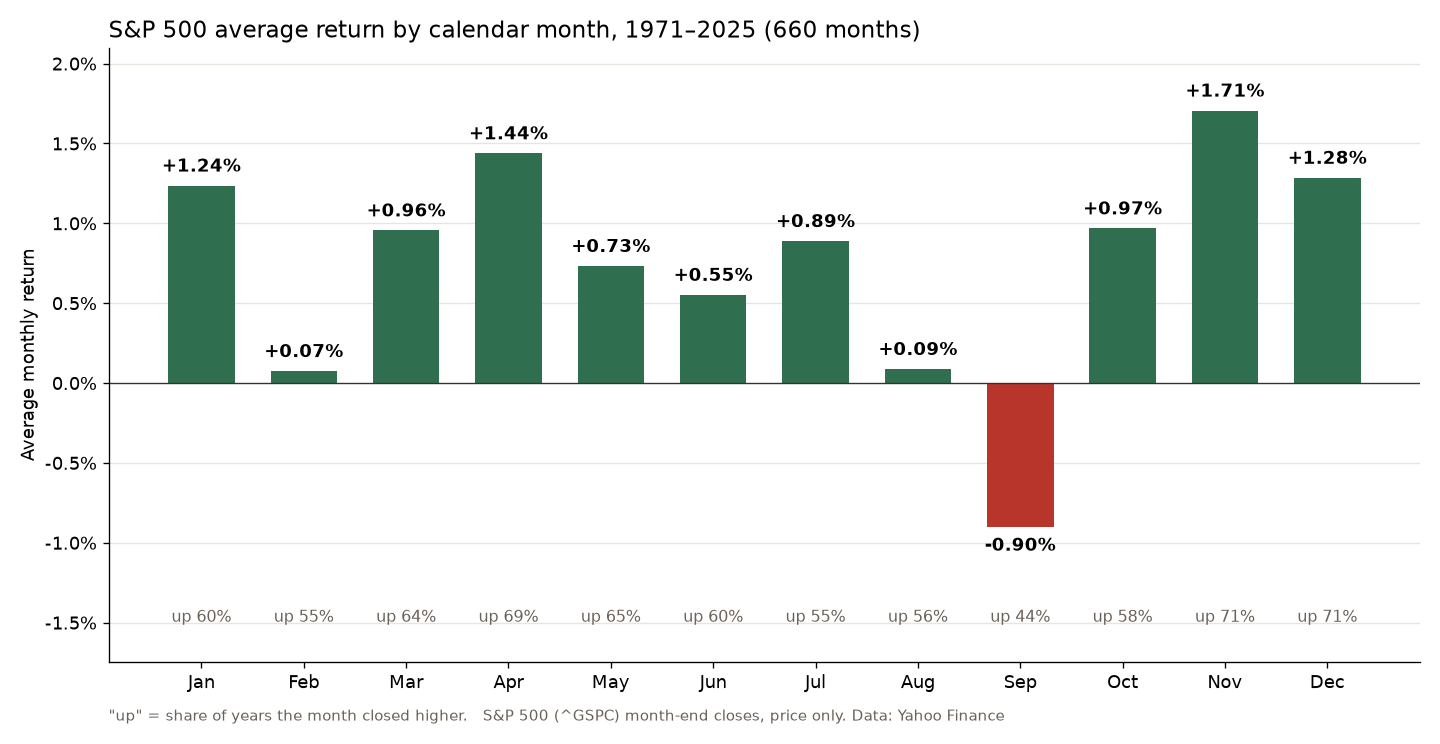
September is the worst month for stocks. From 1971 to 2025 the S&P 500 lost 0.90% in an average September and closed the month higher in only 44% of years. It is the only month with a negative average and the only one that fell more often than it rose. But a typical September swings about 4.5% either way, so the calendar tells you very little about any single year.
September 2026 kept the reputation, barely: the S&P 500 went from 7,686.14 on 31 August to 7,651.54 on 30 September, a 0.45% loss. With October starting today, I took 55 years of month-end closes and checked what the calendar actually says, including whether October deserves its own bad name.
What is the worst month for stocks?
I used the S&P 500’s month-end closes from Yahoo Finance, every month from January 1971 to December 2025. That is 660 months, price only, without dividends. Here are the three weakest and the three strongest months (Up = the share of years the month rose):
| Month | Average | Median | Up |
|---|---|---|---|
| September | −0.90% | −0.35% | 44% |
| February | +0.07% | +0.69% | 55% |
| August | +0.09% | +0.58% | 56% |
| December | +1.28% | +1.26% | 71% |
| April | +1.44% | +0.91% | 69% |
| November | +1.71% | +2.45% | 71% |
The average month made +0.75% and rose 61% of the time. September is the clear outlier on both counts. February and August are weak but still positive on average. The best stretch is November to January, which is the part of the year the old “sell in May” saying is built around.
Is September always a bad month?
No. It was the worst month of its year in only 8 of the 55 years. The worst Septembers were 1974 (−11.9%) and 2002 (−11.0%), and the best was 2010 (+8.8%). The recent run shows how lumpy it is: four losing Septembers in a row from 2020 to 2023, including −9.3% in 2022, then +2.0% in 2024 and +3.5% in 2025.
The effect also looks weaker lately. Over the last 20 years, 2006 to 2025, September still has the lowest average (−0.50%), but its median is +1.07% and it closed higher in 11 of 20 years. A few bad Septembers drag the average down; the typical one is not much different from any other month.
That is the problem with calendar statistics in general. With 55 Septembers and a standard deviation of 4.5% a month, the average itself is uncertain by about 0.6 points either way. And when you look at 12 months and pick the worst one, one of them always has to be the worst. The question is whether it stays the worst in data you didn’t use to find it.
Is October a bad month for stocks?
On average, no. October made +0.97% on average with a median of +1.48% and closed higher in 58% of years, which is middle of the pack. Its bad name comes from two months: October 1987 (−21.8%, the month of the crash) and October 2008 (−16.9%). Those are the two worst months in the whole 55-year sample. Take them out and the October average rises to +1.73%.
What October really is, is volatile. It has the widest range of any month: from −21.8% in 1987 to +16.3% in 1974, and the highest standard deviation, 6.2% against 3.5% to 4.9% for the other months. That doesn’t make October a month to sell. It makes it a month where a stop that is too tight, or a position that is too big, gets found out. If you size from the stop, as I explain in where to put the stop and how much to buy, a wider swing means fewer shares, not a different opinion.
Would skipping September have paid off?
In hindsight, yes, a little. Buy and hold from 1971 to 2025 turned $1 into $74.3, about 8.1% a year, price only. Holding every month except September, and sitting in cash that earned nothing during it, turned $1 into $129.5, about 9.2% a year.
To check that I wasn’t just fitting the past, I split the data in two. In 1971–1997 September was the worst month, and skipping it gave 10.0% a year against 9.1%. In 1998–2025 it was the worst month again, and skipping it gave 8.6% against 7.2%. So the pattern held in both halves, which is more than most calendar effects manage.
Before anyone builds a strategy on it, the costs. The test ignores dividends you would miss for one month a year, the interest cash would earn, trading costs and, in a taxable account, the tax on selling every August. Each of those moves the result by a fraction of a percent a year, some for and some against, and together they need a proper test. And you would still be out of the market in the 44% of Septembers that went up, including +8.8% in 2010.
How I use the calendar
I don’t. When I looked at sell in May and go away in 2022, I found nothing in the summer months worth a rule, and the September numbers don’t change my mind. A −0.9% average against a typical swing of 4.5% is a small tilt, and the trend and the levels on the chart tell me much more about the next few weeks than the page on the calendar. If the S&P 500 is in an uptrend above its 200-day average in September, I stay with it. If it is breaking down in May, I don’t wait for September.
Seasonality is a decent example of what past performance not being indicative of future results means in practice. The pattern is real in the data, it survived a split test, and it is still too small and too noisy to trade on its own. If you want to test it properly, write it as a rule and run it the way I test setups in the Setup Lab, costs included.
FAQ
What is the best month for stocks?
November. From 1971 to 2025 the S&P 500 gained 1.71% in an average November, with a median of +2.45%, and closed higher in 71% of years. April had the second-highest average at +1.44%, and December also closed higher in 71% of years, with a +1.28% average.
What month is the lowest for the stock market?
September, with an average of −0.90% and a median of −0.35% from 1971 to 2025. It is the only month with a negative average. February (+0.07%) and August (+0.09%) are the next weakest, both slightly positive.
Are crashes more likely in October?
The two worst months since 1971, October 1987 and October 2008, both fell in October, and October has the widest swings. Two events are too few to call it a rule, though. On average October has been a positive month, up in 58% of years.
So September earned its name, and October earned its name in two months, 1987 and 2008. Neither is a reason to sell. Watch the trend, size from the stop, and let the calendar be trivia for the coffee break.
Not financial advice. This is educational content, shared for information and entertainment only, and it is not a recommendation to buy or sell any asset. Backtests and past results do not guarantee future results, and the numbers or charts here may contain mistakes. Trading carries risk, including losing all the money you put in. Do your own research before you make any decision.