An iron condor is four options with the same expiry: you sell an out-of-the-money put and an out-of-the-money call, and buy a put and a call further out to cap the loss. You collect a credit and keep it if the price stays between the two short strikes. Cboe has tracked a rule-based S&P 500 iron condor since 1986. Since the index went live in August 2015, it has earned 1.02% a year, less than plain T-bills.
What is an iron condor?
It is two credit spreads on the same stock or index, one on each side of the price. Below the price you sell a put and buy a cheaper put further down, which is a bull put spread. Above the price you sell a call and buy a cheaper call further up, which is a bear call spread. All four options expire on the same day. The two options you sell are the body, the two you buy are the wings, and that is where the bird in the name comes from.
You get paid up front. If the price at expiry is between the two short strikes, all four options expire worthless and the credit is your profit. If it moves past one of the short strikes, you start giving the credit back, and past the long strike on that side the loss stops growing. Only one side can lose at expiry, because the price can’t be below the puts and above the calls at the same time. So the maximum loss is the width of the wider wing minus the credit. It is a bet that the market stays in a range, with the risk defined before you enter.
An iron condor example with real SPY quotes
I took the Cboe delayed quotes for SPY, the S&P 500 ETF, at the close on 7 October 2026, when SPY closed at 777.22. To match the index I test below, I picked the 20 November 2026 expiry (44 days away) and the strikes with deltas nearest to 0.20 for the short options and 0.05 for the long ones. Sells fill at the bid, buys at the ask.
| Leg | Delta | Price |
|---|---|---|
| Buy 685 put | −0.05 | −1.36 |
| Sell 745 put | −0.20 | +4.90 |
| Sell 810 call | 0.19 | +3.10 |
| Buy 835 call | 0.05 | −0.56 |
| Net credit | +6.08 |
That is $608 per condor. The profit zone runs from 738.92 to 816.08, about 4.9% below and 5.0% above the price. Inside it you keep something, and between 745 and 810 you keep all of it.
Now look at the wings. The put wing is 60 points wide (745 to 685), the call wing only 25 (810 to 835). Same deltas, very different distances, because out-of-the-money puts on the S&P 500 are priced richer than calls. The market pays more for crash insurance than for a rally ticket. So the maximum loss is on the put side: 60 − 6.08 = 53.92, or $5,392. On the call side it is $1,892. You risk $5,392 to make $608 in 44 days, 11.3% on the money at risk if it works. Win most months and lose the full amount once, and that once takes about nine good months back.
What Cboe’s iron condor index does
Cboe publishes the S&P 500 Iron Condor Index, ticker CNDR, with its rules in a methodology paper. Once a month, on the third Friday, it sells a one-month SPX put with a delta of about −0.20 and a call of about 0.20, and buys a put of about −0.05 and a call of about 0.05. The options are SPX, the S&P 500 index itself, which is roughly ten times the SPY price. It holds them to expiry, with no adjustments and no early exits.
The part most people miss is the cash. The index holds a T-bill account worth ten times the maximum possible loss of the new position, so in Cboe’s words the maximum loss at settlement is “approximately 10% of the total value of the account”. That is a condor run with a lot of cash behind it, not a condor on margin. Two more details matter. The index prices every option at the average of the bid and ask, so it pays no spread and no commissions. And the base date is 20 June 1986 while the launch date is 3 August 2015: everything before August 2015 is a back-test Cboe built at launch, a point its own disclaimer makes.
38 years of data: iron condor vs the S&P 500
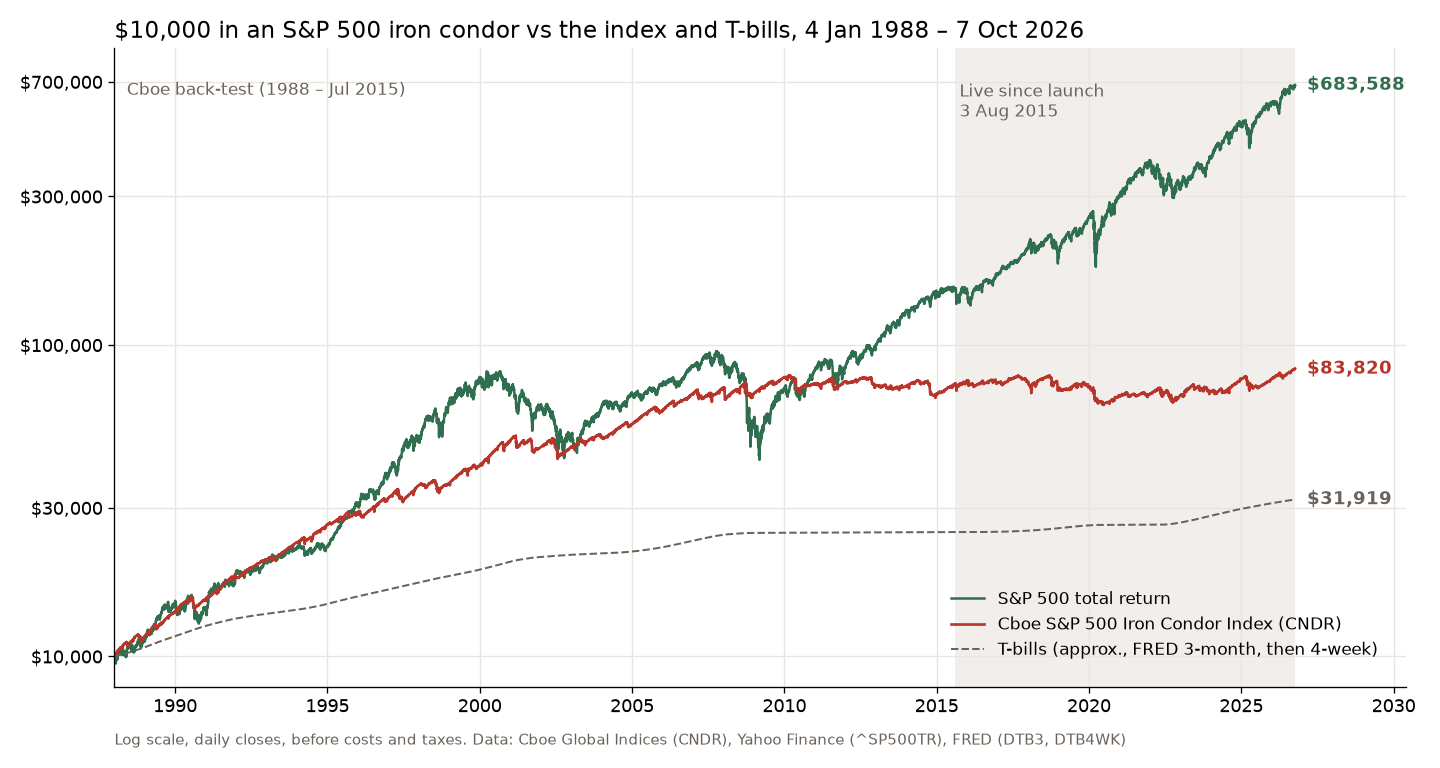
I compared CNDR’s daily closes with the S&P 500 total return index (dividends included, from Yahoo Finance) on the 9,759 days both have, from 4 January 1988 to 7 October 2026. For a cash benchmark I compounded the T-bill rates from FRED: the 3-month bill until July 2015, the 4-week bill after. That bill line is an approximation, simple daily interest, but close enough to compare.
| 1988 – 2026 | Condor | S&P 500 |
|---|---|---|
| $10k became | $83,820 | $683,588 |
| Per year | 5.64% | 11.52% |
| Volatility | 7.2% | 17.8% |
| Max drawdown | −19.7% | −55.3% |
Over the whole run the condor did what the textbook says. Less than half the return, less than half the swings, and a worst drop of 19.7% against 55.3% for the index. It was up in about 72% of months since 1986. It beat the S&P 500 in 11 of the 37 full calendar years from 1989 to 2025, mostly in bad ones: 2000 was its best year at +20.8% while the index lost 9.1%, and it also came out ahead in 2001, 2002, 2008 and 2022. Its worst months were October 1987 (−9.9%, in the back-test), September 2001 (−8.4%) and May 2010 and August 2011 (−7.9% each). Those are close to the 10% cap the cash cushion sets.
Back-test vs live: where the edge went
Split the same numbers at the launch date, back-test from 4 January 1988 to 31 July 2015 and live from 3 August 2015 to 7 October 2026, and the picture changes completely.
| Per year | Back-test | Live |
|---|---|---|
| Condor | 7.58% | 1.02% |
| S&P 500 | 10.38% | 14.41% |
| T-bills | 3.39% | 2.19% |
In the back-test the options added about four percentage points a year over the cash they sat on. Since launch, $10,000 has turned into about $11,200. The worst drawdown of the whole series came in the live period, −19.5% to 26 June 2020, and 2020 was the condor’s worst calendar year at −6.1% while the S&P 500 made 18.4%. A sharp crash and then a fast rally is the worst case for a condor: it can lose on the put side and then on the call side within a few months.
My first guess was low interest rates. With bills near zero for years, the 10-to-1 cash cushion earned nothing, so the index had to live on the option premium alone. The numbers don’t support that. From August 2015 to the end of 2021, bills paid about 0.86% a year and the condor lost 1.14% a year. From 2022 to now, bills paid about 4.03% a year and the condor made 4.01%. Both periods say the same thing: since launch, the option part of the trade has added roughly nothing, or less. At the index’s leverage, the iron condor on the S&P 500 has not paid more than T-bills since Cboe started publishing it live.
I’m careful with what that proves. It is one set of rules: 20-delta short strikes, monthly, held to expiry, no management. Other deltas, other expiries or other underlyings will give other numbers, and a trader who sizes the condor with less cash behind it will see bigger swings both ways. But this is the plain version options courses usually teach. It is priced at the mid with no costs, and it still didn’t beat cash for eleven years.
Iron condor vs iron butterfly
The iron butterfly is the same trade with the short strikes moved to the middle. Cboe’s BFLY index sells an at-the-money put and call each month and buys a put and a call 5% out of the money, with the same ten-times-the-max-loss cash rule and the same 1986 base and 2015 launch dates. More premium, a much narrower zone where you keep it.
On the same 10,147 days from 20 June 1986 to 7 October 2026, the condor made 5.37% a year with a −19.8% worst drawdown, the butterfly 3.66% with −54.9%. Since the 2015 launch the condor made 1.02% a year and the butterfly lost 2.74% a year, with a drawdown of 42.4%. On Cboe’s rules the condor beat the butterfly in both periods with less than half the drawdown.
Is an iron condor a good strategy?
It is a good way to learn how options are priced and a poor way to get rich slowly. The return on risk looks great on a single trade, 11.3% in 44 days in my SPY example. That number assumes you keep the whole credit. Over many months, the market charges roughly what the risk is worth, and on the S&P 500 since 2015 the condor’s option leg has netted about zero.
If I trade one, I treat it like any other position with a stop: I decide the maximum loss before entry, I size it so that losing it is a normal bad month and not an event, and I know which side breaks first. With the put skew, that is usually the downside. I found the same pattern with covered calls and cash-secured puts: selling options pays steady small gains and hands some of them back in the bad months. The poor man’s covered call adds leverage on top. Nassim Taleb writes about traders who look brilliant until the rare bad month arrives in Fooled by Randomness.
FAQ
How does an iron condor make money?
From time decay and a quiet market. You sell two options that are likely to expire worthless and keep the credit if the price stays between the short strikes until expiry. The long wings don’t make money on their own; they cap how much a big move can cost you.
What is the max loss on an iron condor?
The width of the wider wing minus the credit, times 100 per contract. In my SPY example the put wing was 60 points wide and the credit 6.08, so the most it could lose was $5,392. Only one side can lose at expiry, so you don’t add the two wings together.
Which is better, an iron condor or an iron butterfly?
On Cboe’s index rules, the condor. From 1986 to 2026 it made 5.37% a year against 3.66% for the butterfly, with a −19.8% worst drawdown against −54.9%. Since the 2015 launch the condor made 1.02% a year and the butterfly lost 2.74% a year.
What is the opposite of an iron condor?
A reverse iron condor: you buy the inner put and call and sell the outer ones. You pay a debit instead of collecting a credit, and you profit when the price moves far enough in either direction. It is a bet on a big move instead of a quiet market.
The iron condor sells calm. Since 2015, the S&P 500 has paid about T-bill rates for it, before the spread you pay on four legs. If you trade it, size it for the month it goes wrong, not for the months it goes right.
Not financial advice. This is educational content, shared for information and entertainment only, and it is not a recommendation to buy or sell any asset. Backtests and past results do not guarantee future results, and the numbers or charts here may contain mistakes. Trading carries risk, including losing all the money you put in. Do your own research before you make any decision.