On Friday, 9 October 2026, the S&P 500 closed at 7,811.54, about 7.7% above its 200-day moving average of roughly 7,251. It has closed above the line every day since 8 April. I went through 76 years of daily closes to see what being above or below the 200-day actually tells you. It doesn’t predict returns very well. It predicts the ride: below the line, the swings get much bigger.
What is the 200-day moving average?
Add up the last 200 daily closes and divide by 200. That is the simple 200-day moving average, and it covers about ten months of trading. Each day the oldest close drops out and the newest one comes in, so the line moves slowly and lags the price by design. Some investors use a 10-month or 40-week average instead, which is roughly the same thing on a coarser clock. Above a rising 200-day is the textbook definition of a long-term uptrend; below a falling one, a downtrend. All the numbers here are my own calculation on Yahoo Finance closes of the S&P 500 index (^GSPC), price only.
Where is the S&P 500 versus its 200-day moving average now?
The last close below the line was 7 April 2026: 6,616.85 against a 200-day average of about 6,651. Since then the index has stayed above it for 129 sessions in a row and the line itself has turned up – it rose 1.2% over the last 20 sessions. At 7.7% above, the index is stretched but not extreme. Since 1950 it was even further above the line on 28.8% of all days. The record is +23.1% on 3 November 1982; the deepest point below was −39.6% on 20 November 2008.
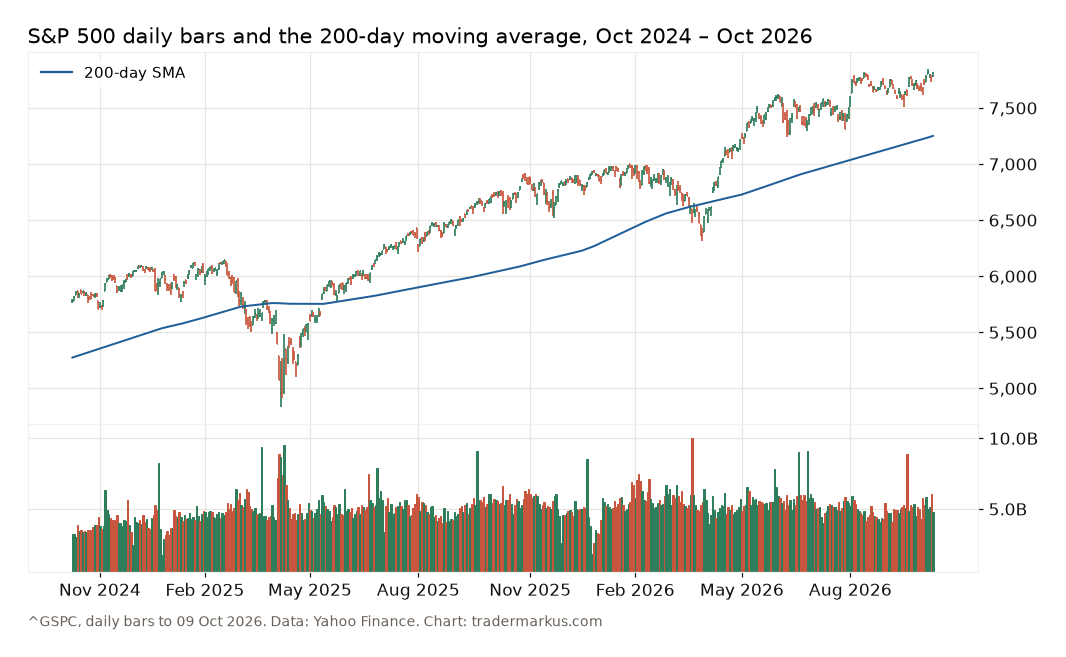
The chart shows two recent breaks. In March 2025 the index slipped below the line, fell well under it in April, and was back above by 12 May. In 2026 it closed below on 19 March, spent less than three weeks there and started the current run on 8 April.
Does the 200-day predict where the S&P 500 goes next?
I split all 19,315 trading days since 3 January 1950 into two groups: closes above the 200-day (71.9% of days) and closes below it. Then I measured the index 1, 3 and 12 months later (21, 63 and 252 sessions).
| After | Above | Below |
|---|---|---|
| 1 month | 64% up, +0.9% | 57% up, +0.6% |
| 3 months | 71% up, +2.5% | 57% up, +1.6% |
| 12 months | 76% up, +9.4% | 71% up, +9.4% |
Average returns, price only. Over one to three months, above the line was better: up more often and by more. Over a year the average is the same, 9.43% against 9.40%, and the median is actually higher from below the line, 13.0% against 9.9%. What differs is the spread. The 12-month returns from below the 200-day had a standard deviation of 20.1 points against 13.8 from above. Below the line you get the worst years and the best rebounds. Fresh crosses tell the same story: a year after the index first closed below the line, it was higher 68% of the time, by a median 9.8%.
How often does the S&P 500 cross its 200-day moving average?
More often than the headlines suggest. Since 1950 the index closed below the line after a close above it 226 times, about 2.9 times a year, and 96 of those came after 2000. Most of them were noise: 157 of the 226 (69%) were back above within ten sessions.
The runs above the line are just as uneven. The median run lasted 5.5 sessions, and 59% were over within ten. Only 40 of the 226 finished runs lasted as long as the current one (129 sessions). The longest were 628 sessions from November 1953 to May 1956, 525 from July 1996 to August 1998, and 477 from November 2012 to October 2014. So a long run is normal in a bull market, and a quick dip below the line usually isn’t the end of it.
The 200-day moving average rule: 38 years with dividends
The classic way to trade it: hold the S&P 500 while it closes above its 200-day, move to cash when it closes below. I tested it from 4 January 1988 to 9 October 2026 with the total return index (^SP500TR, dividends included) and 3-month Treasury bills from FRED as the cash leg, switching at the close of the day the signal appears. No trading costs, no taxes. A price-only test would flatter the rule, because buy-and-hold would lose its dividends while the rule sits in cash.
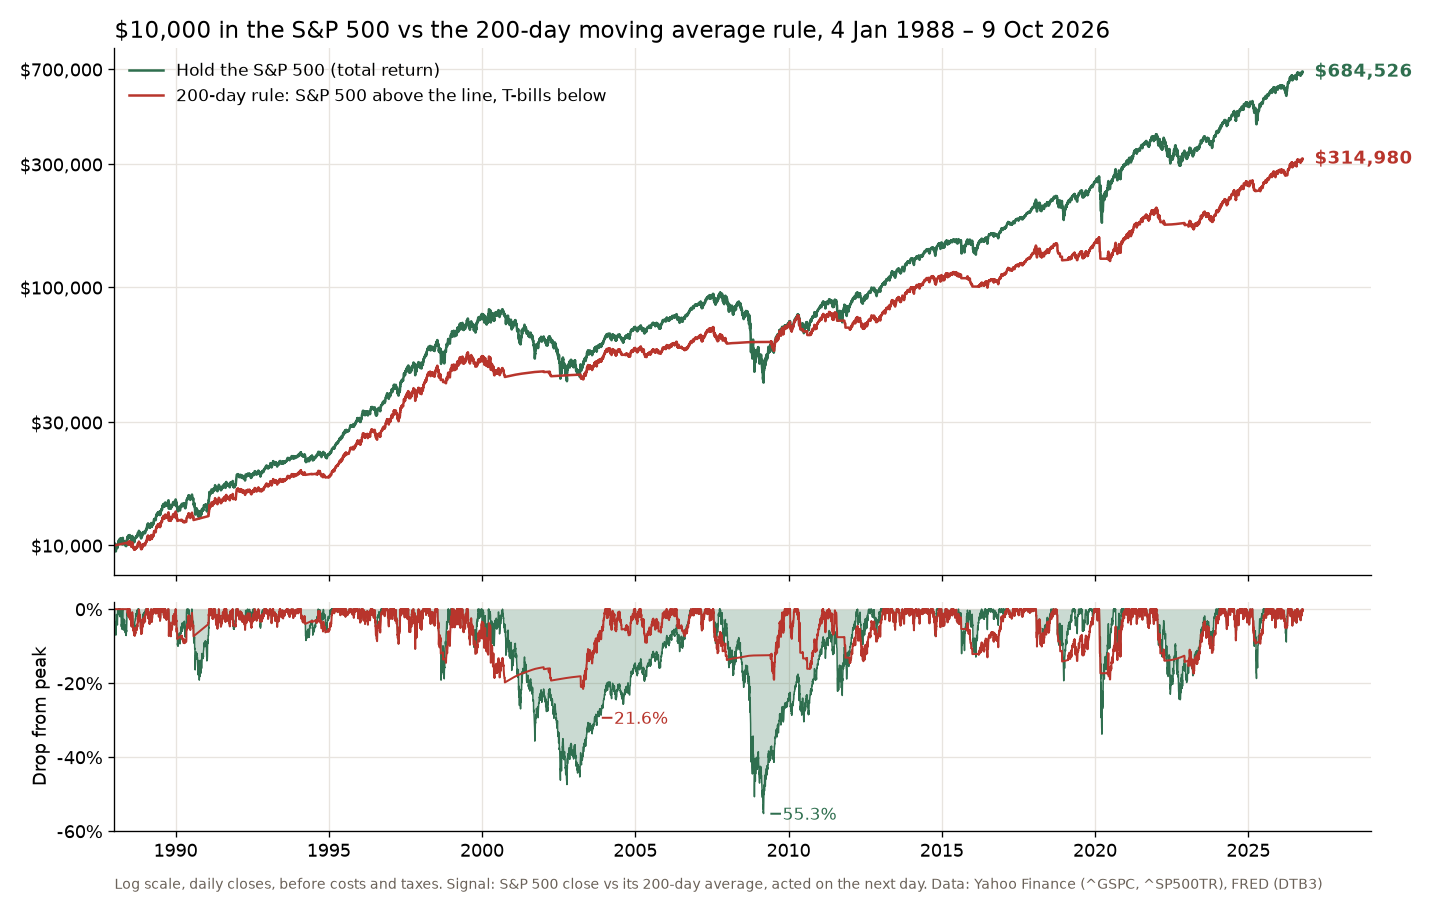
$10,000 held the whole time grew to $684,526, or 11.52% a year. The 200-day rule ended at $314,980, 9.31% a year. In exchange, its worst fall was −21.6% (April 2003) against −55.3% for buy-and-hold (March 2009), and its volatility was 11.4% a year instead of 17.8%. It made 129 entries in 38 years and was invested 75.6% of the time. In the tables below, the first number is the return per year, the second the worst fall from a peak.
| From | Hold | Rule |
|---|---|---|
| 1988 | 11.52% −55.3% |
9.31% −21.6% |
| 2000 | 8.44% −55.3% |
6.83% −19.1% |
| 2010 | 14.29% −33.8% |
9.19% −19.0% |
Whatever start you pick, the pattern holds: the rule cut the worst fall by more than half and paid for it with 1.6 to 5.1 points of return a year. It is insurance, and the premium was high in the long bull market after 2010. One more warning: on a daily check the result is sensitive to timing. Switching one day later than the signal gives 9.94% a year from 1988 instead of 9.31%. When a rule moves half a point on a one-day delay, the line is mostly noise around the crossings.
Daily or monthly? My 2021 rule, checked five years later
In February 2021 I wrote how to beat the S&P 500 index with market timing: check the 200-day only at the end of each month, buy or sell on the next open. From 2000 to February 2021 that test, price only, showed 7.05% a year against 4.81% for buy-and-hold and a −17% worst fall against −57%. I rebuilt it here. Price only, I get 7.50% against 4.82%, close enough given the next-open fills and fees in the original. With dividends and T-bill interest on both sides, it was still ahead over those 21 years: 9.51% against 6.87%. The table runs the same monthly rule, with dividends, over longer and later periods (2021 = from my post on 12 February 2021, 2026 = to 9 October 2026).
| Monthly rule | Hold | Rule |
|---|---|---|
| 2000–2021 | 6.87% −55.3% |
9.51% −17.4% |
| 2000–2026 | 8.44% −55.3% |
9.31% −24.0% |
| 1988–2026 | 11.52% −55.3% |
10.55% −24.0% |
| 2021–2026 | 14.52% −24.5% |
8.55% −24.0% |
Two things stand out. First, over the long run the monthly check beat the daily one: 10.55% against 9.31% a year since 1988 and 10.05% against 9.19% since 2010, with 49 switches instead of 257 over the full period. Looking less often filtered out most of the whipsaw. Second, the years since my post were the hardest stretch for the monthly rule. In 2022 and 2023 it got whipsawed: it sold at the end of February 2022 and bought back a month later, sold again in April, and in late 2023 sold at the end of October only to buy back a month later about 9% higher. Its deepest fall in 38 years, −24.0%, came in March 2023 – about the same as just holding. Since February 2021 it made 8.55% a year against 14.52%, and this time even the daily rule did better (12.14%). That is what out-of-sample looks like. The rule still did its job over 26 years, but five bad years can feel like a lifetime when you are the one following it.
How I use the 200-day
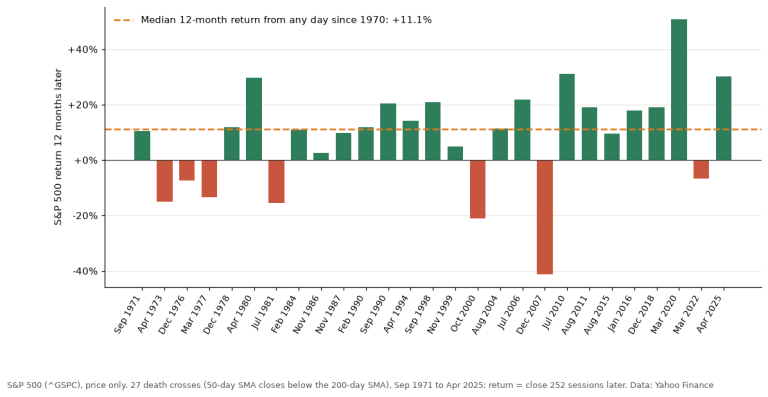
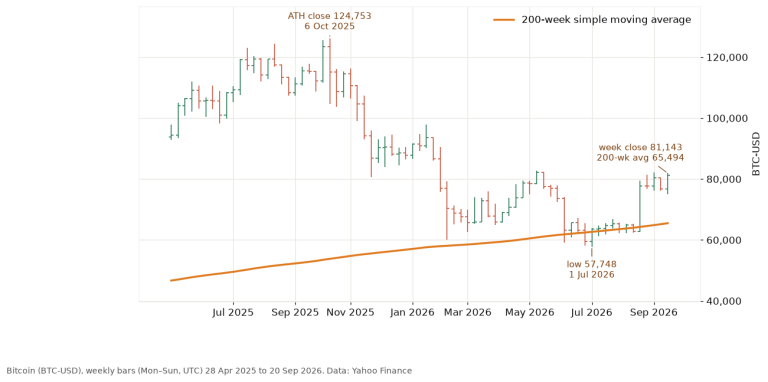
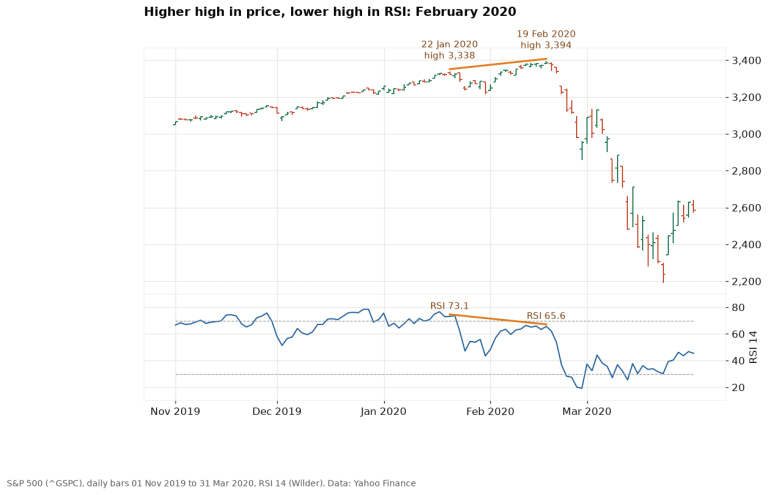
As a map, not a trigger. Above a rising 200-day I treat dips as dips and size positions normally. Below a falling one I expect bigger swings in both directions, so I trade smaller and keep stops wider or stay out. That is what the numbers support: the line tells you more about risk than about returns. The 50/200 crossovers carry the same message – my death cross study found a year later the market was usually higher, and the golden cross test in the Setup Lab shows what the signal looks like as a strict rule on 56 years of data. I also ran the same idea on a longer clock in the Bitcoin 200-week moving average post.
FAQ
What is the 200-day moving average of the S&P 500 right now?
About 7,251 at the close of 9 October 2026, by my calculation from Yahoo Finance daily closes, with the index at 7,811.54 (the same close at Cboe). The line rises by roughly 4 to 5 points a day at the moment. Charting sites can differ slightly depending on data and rounding.
Is the 200-day moving average a good indicator?
For risk, yes. For predicting returns, not much. Since 1950 the average 12-month return was the same above and below the line, but returns from below it were far more spread out. As a daily trading rule it cut the worst fall by more than half, at the cost of 1.6 to 5.1 points of return a year depending on the start date.
Is SPY’s 200-day the same as the S&P 500’s?
Almost. SPY tracks the index, so its line sits at about a tenth of the index level: SPY closed at 778.57 on 9 October 2026 against a 200-day of about 723, 7.7% above it. Since 1993 SPY and the index were on the same side of their 200-day lines on 99.4% of days.
What happens when the S&P 500 falls below the 200-day moving average?
Usually not much: 69% of the breaks since 1950 were reversed within ten sessions. The rare ones that stick, like 2000–2002 and 2008, are where the big drawdowns live. The line can’t tell you in advance which kind of break you are looking at.
The 200-day is a slow line on a fast market. It won’t make you rich and it won’t call the top. What it does well is tell you when the ground is getting shaky – and that is when position size matters most.
Not financial advice. This is educational content, shared for information and entertainment only, and it is not a recommendation to buy or sell any asset. Backtests and past results do not guarantee future results, and the numbers or charts here may contain mistakes. Trading carries risk, including losing all the money you put in. Do your own research before you make any decision.