Boeing stock fell 6.9% on Monday, 28 September, closing at $184.39 after the FAA said it will delay certification of the 737 Max 10 until a new software issue is resolved. On the chart, the drop broke the March low at $187.72, left a gap up to $196.80 and put BA at its lowest close since November 2025. The next support I see is the November low at $176.77.
Update, 9 October 2026: the gap has been filled, but the stock couldn’t hold it. Boeing bounced into the gap on 1 October and reached $196.93 on 2 October, just above the gap top of $196.80. The best close was $193.56. By Friday, 9 October, it was back at $190.37, between the March low and the bottom of the gap. The 28 September low of $184.01 hasn’t been broken, and neither has the November low at $176.77. The 50-day average has fallen to $209.76. (Closing prices: Nasdaq.)
Why Boeing stock fell on 28 September
Over the weekend Boeing said a software issue on certain 737 Max aircraft could stop pilots from using automated flight guidance in one landing scenario, the go-around, where the crew aborts a landing and climbs away to try again. The software comes from GE Aerospace. On Monday FAA Administrator Bryan Bedford said: “We will be delaying the 10 until we’re satisfied that we don’t have an issue here.” He didn’t say for how long. The FAA plans a Corrective Action Review Board, probably not before next week, and certification had been widely expected in October (Reuters via CP24, MarketScreener).
It wasn’t a good day for the market either. The S&P 500 fell 0.77% to 7,683.69 on higher Treasury yields and oil, so Boeing’s news landed on a weak tape.
What the BA chart says
I care less about the headline than about where it hit the chart. Boeing was already in a downtrend before the news: it closed at $240.19 on 5 August and had drifted lower for seven weeks, closing at $198.07 on Friday. Monday opened at $192.62, never got back above $192.77 and closed at $184.39, a few cents above the day’s low of $184.01. Closing at the low of a gap-down day means nobody stepped in to buy the dip that afternoon.
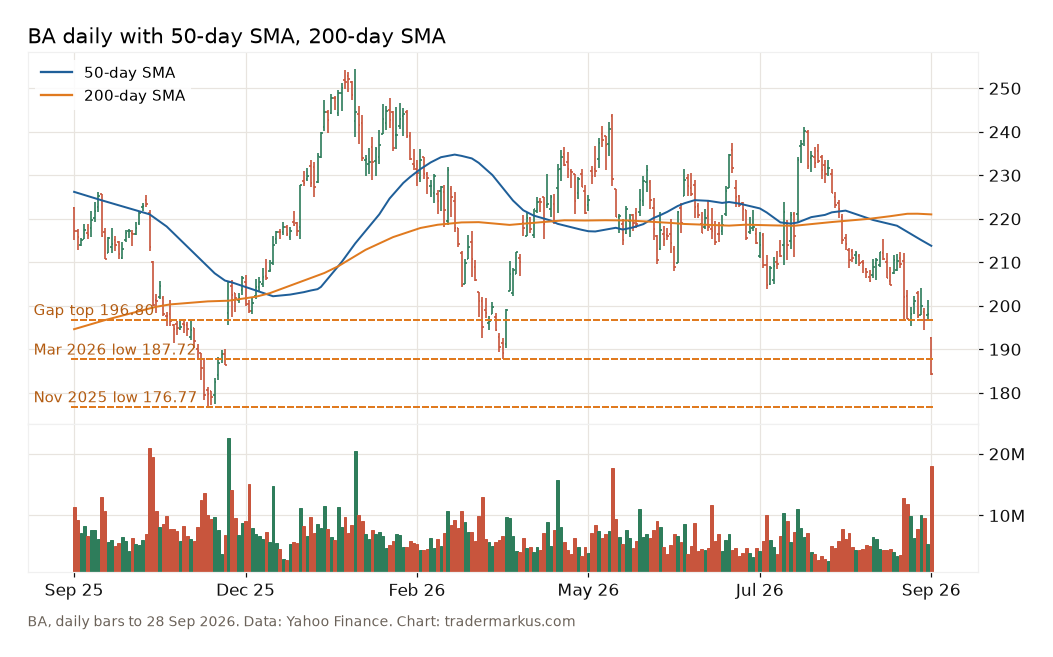
The levels I’d mark, all from Nasdaq and Yahoo daily data to 28 September:
| Level | Price | What it is |
|---|---|---|
| 200-day SMA | $221.00 | Long-term trend line, flat |
| 50-day SMA | $213.78 | Falling since August |
| Gap top | $196.80 | Friday’s low |
| Gap bottom | $192.77 | Monday’s high |
| March low | $187.72 | 30 March 2026, now broken |
| November low | $176.77 | 21 November 2025, the 1-year low |
Volume was 18.05 million shares, about three times the 50-day average of 6.1 million. Somebody big wanted out. The stock is now 15% below its 2025 close of $217.12 and about 28% below the intraday high of $254.35 from 27 January.
The death cross came first
The 50-day average crossed below the 200-day on 1 September, four weeks before the FAA news. I wouldn’t give that much credit, though. BA’s moving averages have crossed six times since February 2025 (death crosses in December 2025, April 2026 and September 2026, golden crosses in between), which is what averages do when a stock goes sideways in a wide range. In my study of 27 death crosses on the S&P 500 the signal alone told you very little about the next 12 months, and on a single stock it whipsaws even more. What matters more to me is that price is now below both averages and both are pointing down or flat.
How I’d think about the risk from here
There are two obvious scenarios on this chart, and I don’t know which one plays out.
- The gap fills. News-driven gaps often get retested. A rally into $192.77–196.80 that stalls there would be the gap acting as resistance, and the broken March low at $187.72 sits right below it.
- The slide runs into the November low. $176.77 is the last clear support on the 1-year chart. Below it there’s nothing from the past year to lean on.
A worked example, not a trade: someone who wants to buy the dip at Monday’s close of $184.39 with a stop under the November low, at $175.50, is risking $8.89 a share. With a $25,000 account and 1% risk, that’s $250 of risk, so 28 shares, about $5,160 of stock. The chart sets the stop and the stop sets the size (more on that in my post on where to put a stop loss). If $8.89 feels too wide, the position is too big, not the stop too far.
The other thing to remember is that this story has no fixed end date. The FAA didn’t say how long the delay will be, and Bedford said himself he couldn’t tell whether a fix takes days, weeks or months. A stock waiting on a regulator can gap again, either way, on any headline. I wrote years ago that price makes news, not the other way around, and Boeing had been falling for weeks before Monday. I’d rather follow what the chart does at $176.77 and $196.80 than guess what the review board decides.
My takeaway: the news explains the gap, the chart tells you where you’re wrong. Right now that’s below $176.77 for the bulls and above $196.80 for the bears.
Not financial advice. This is educational content, shared for information and entertainment only, and it is not a recommendation to buy or sell any asset. Backtests and past results do not guarantee future results, and the numbers or charts here may contain mistakes. Trading carries risk, including losing all the money you put in. Do your own research before you make any decision.