The 5-year Treasury yield closed at 4.99% on 23 September 2026, its highest close since July 2007, after touching 5% during the day. For stocks this matters more than it sounds: a risk-free 5% for five years is real competition for equities, and it makes the future profits of growth companies worth less today. The Nasdaq and the Russell 2000 took the hit first, which is usually how it goes.
Update, 9 October 2026: the 5% has held so far. In the 12 sessions after 23 September the 5-year closed at 5% or above on 10 of them. It peaked at 5.09% on 30 September, its highest close since 6 July 2007, and closed at 5.02% on Friday, 9 October. The 10-year was at 5.24% and the 2-year at 4.80% (Treasury daily yield curve).
Here are the numbers from the Treasury’s own daily yield curve. The 5-year par yield went from 4.83% on 22 September to 4.99% on 23 September, a 16 basis point jump in one session. The 10-year closed at 5.11%, the 2-year at 4.85% and the 30-year at 5.40%. The last time the 5-year closed at 5% or above was 13 July 2007, at 5.01%. This year it started at 3.74% on 2 January and made its low at 3.51% on 27 February. That is almost 1.5 percentage points in seven months.
What pushed yields up on 23 September
Three things landed on the same day. S&P Global’s flash composite PMI for September came in at 58.4, and the firm’s chief business economist said US output was growing at the fastest rate in over five years. Oil stayed high, with WTI at around $92 and Brent near $98, according to Yahoo Finance’s market report. And traders priced about a 71% chance of another quarter-point Fed hike at the October meeting, per the CME FedWatch tool. A strong economy plus expensive energy means inflation risk, and inflation risk means bond buyers want more yield. The S&P 500 fell 0.8% on the day and the Nasdaq 1.1%.
None of that is a surprise on its own. What is new is the level. Round numbers mean nothing to a bond’s math, but they mean a lot to people, and “5% on a Treasury” is a headline that makes a lot of investors look at their stock portfolio and ask what they are being paid for the risk.
Why the 5-year Treasury yield matters for stocks
The 5-year note sits in the middle of the curve. It reacts to what the market thinks the Fed will do over the next few years, which is why it moves faster than the 10-year when rate expectations change. Many loans loosely track it too, from car loans to the corporate debt companies have to refinance.
Cash becomes competition
Simple arithmetic: $10,000 in a 5-year Treasury at 4.99% pays about $499 a year, and you get the $10,000 back at maturity if you hold it. No drawdown, no earnings season. A stock has to offer more than that to be worth the risk. When the safe rate was 3.5% in February, that bar was lower. Every step up in yields raises it, and money slowly moves from stocks to bonds and cash at the margin.
Growth stocks feel it most
A company expected to earn most of its profits many years from now is hit hardest by a higher discount rate, because those distant dollars are worth less today. That is why the Nasdaq usually drops more than the Dow on days like this. On 23 September it did exactly that.
Small caps carry more debt
Smaller companies tend to rely more on bank loans and debt that resets or has to be refinanced sooner, so higher rates reach their income statements faster. The Russell 2000 closed at 2,838.66 on 23 September, down 1.3% from Monday’s close of 2,875.36. The S&P 500 lost about 0.8% over the same two sessions.
What the 5-year yield chart shows
I look at the yield the same way I look at any other chart. The 50-day average has pointed up since March, and each dip in the yield has been bought, from about 4.00 in April to the 4.40 area in August. In September the move got steeper: a fast push from 4.40 to above 4.80, a pause of about a week between 4.78 and 4.86, and then the jump to 5.00 on the chart. That pattern, a trend, a short sideways pause and another push in the same direction, is a continuation until it isn’t.
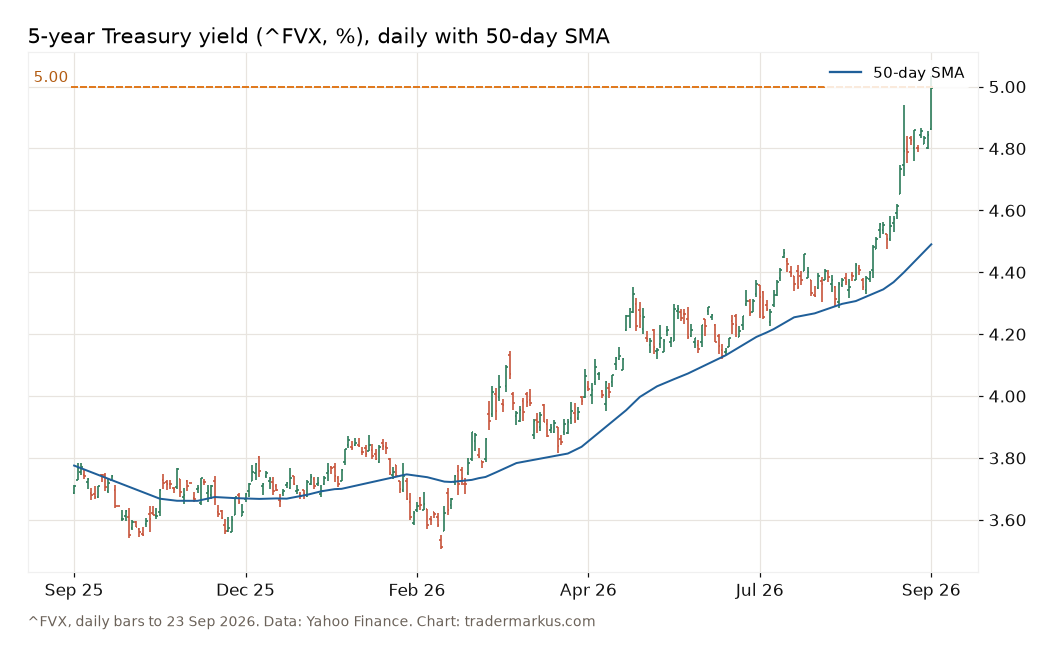
The chart uses Cboe’s 5-year yield index (^FVX), which closed at 5.00 on 23 September; the Treasury’s official figure for the same day is 4.99%. What would change my read: the yield falling back below the September pause around 4.80. That would say the push to 5% was a spike, not a new level. Above 5%, the next reference on a long chart is the 2007 high of 5.18%, set on 12 June 2007. I don’t have a view on where yields end the year, and I don’t think anyone who says they do can be trusted with it.
What I do with this as a trader
Nothing dramatic. I don’t sell everything because a yield touched a round number. Trade your system, not the news still applies. But a rising yield trend is a reason to respect the risk side more: smaller position sizes on the rate-sensitive names, stops where the chart says, and no averaging down into falling growth stocks because they “look cheap”. A stock can look cheap for a long time when the risk-free rate keeps rising. I also keep the same risk per trade instead of betting bigger to make back a bad week. The S&P 500 levels I am watching this week are on the weekly levels page.
FAQ
What is the 5-year Treasury yield today?
On 23 September 2026 the Treasury’s official 5-year par yield closed at 4.99%, the highest close since 13 July 2007. It touched 5% during the session. The Treasury publishes the daily figures on its daily yield curve page.
Why do stocks fall when bond yields rise?
Higher yields give investors a safer alternative to stocks and raise the rate used to value future profits. Growth stocks, whose profits sit further in the future, and smaller companies with more debt usually fall the most.
Is a 5% Treasury yield high?
Compared with the last 18 years, yes. The 5-year did not close at 5% or above at any point between July 2007 and September 2026. Compared with the 1980s and 1990s, it is ordinary.
The bond market just asked every stock to earn its place again. Most of the good ones will. The rest will find out what 5% competition feels like.
Not financial advice. This is educational content, shared for information and entertainment only, and it is not a recommendation to buy or sell any asset. Backtests and past results do not guarantee future results, and the numbers or charts here may contain mistakes. Trading carries risk, including losing all the money you put in. Do your own research before you make any decision.