NVDA closed at a record $238.90 on Monday, 5 October, so there is no old resistance left above it. The levels that matter now are below: the May record high at $236.54, the late-September shelf around $228, the 50-day average near $219, and the 200-day near $201. Above, all you have is the round $250 and a measured-move projection near $283.
Nvidia had spent almost five months under its 14 May high. On Friday, 2 October, it traded above it for the first time, and on Monday it closed above it too, with an intraday high of $240.10. Foxconn’s record September revenue, more than NT$1 trillion in a month for the first time, gave the AI trade another push that morning (DigiTimes). The stock is up 28% this year, from $186.50 at the end of 2025. Prices here are Nasdaq daily closes.
What the NVDA chart says
Here are six months of daily bars with the 50-day and 200-day averages and the three horizontal levels I’d draw.
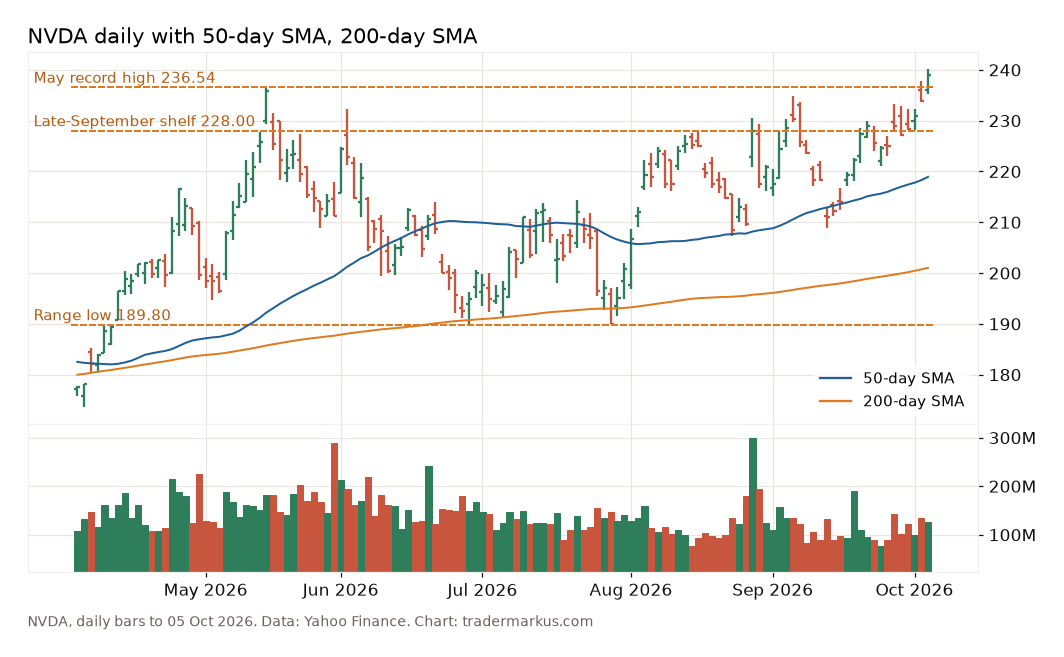
The picture is a range and a breakout. From the 14 May high of $236.54 the stock fell to $189.80 on 29 June, a drop of 19.8%. That is just short of the 20% that would get it called a bear market on TV. Then it spent the summer between about $190 and $235. The low held twice (the close on 29 July was $190.01), the 50-day turned up again in August, and in September the stock pressed against the old record twice: $234.76 on 4 September and $233.21 on 28 September. The third push went through.
NVDA support levels
Old resistance tends to become new support. It doesn’t always work, but it is the first place I’d look after a breakout. Distances are from Monday’s close of $238.90.
| Level | Price | From $238.90 |
|---|---|---|
| May record high | $236.54 | −1.0% |
| Late-September shelf | $227.03 | −5.0% |
| 50-day average | $218.92 | −8.4% |
| September low | $208.93 | −12.5% |
| 200-day average | $201.02 | −15.9% |
The shelf is the lowest of the four lows from 28 September to 1 October, which all sit between $227.03 and $228.17. The 50-day is close to the 10, 17 and 18 September lows of $217–218, and the 24 August low of $207.25 sits just under the September low. Under the 200-day there is only the summer range low at $189.80, and below that the chart is broken.
The breakout level: $235–236.50
This is the one to watch this week. A clean breakout often comes back to test the level it broke, and a buyer who missed Friday usually waits there. If NVDA pulls back to $235–236.50 and holds, the breakout is doing what it should. If it closes back below $234.76, the September high, I’d treat the breakout as failed and the stock as back inside its old range. I’ve seen plenty of breakouts at a record fail, and they rarely take their time about it.
The shelf at $228 and the 50-day at $219
The four days before the breakout all found buyers around $228. That shelf is the obvious place for a stop under a breakout trade, which is also why it can get run if the stock comes back to it. Below it, the 50-day average at $218.92 has been the line between up and sideways since August. Since 15 May the stock closed below the 50-day on 32 of 98 days, but below the 200-day only once.
Where is NVDA resistance now?
At a record high there is nobody left who bought higher and wants to get out at break-even, which is what old resistance really is. So the answer is: none on the chart. What people use instead are round numbers and projections. $250 is 4.6% above Monday’s close, and round numbers do attract orders. The measured move takes the height of the range ($236.54 − $189.80 = $46.74) and adds it to the breakout level, which gives about $283. I’d treat that as a textbook exercise, not a target. Ranges don’t know about textbooks.
Is NVDA overextended?
Monday’s close was 9.1% above the 50-day average and 18.8% above the 200-day. That sounds stretched, but it is normal for this stock. Since the start of 2023 NVDA has closed at least 9.1% above its 50-day on 38% of trading days, and at the peak it was 42% above it. Stretched just means a pullback to the breakout zone or the shelf wouldn’t surprise me. It doesn’t mean the trend is over. The trend is over when the levels in the table start to break.
How I’d size a trade around these levels
A worked example, not a trade. Someone who wants to buy a pullback into the breakout zone at $236.50, with a stop under the September shelf at $226.90, is risking $9.60 a share. With a $10,000 account and 1% risk, that’s $100, so 10 shares, about $2,365 of stock. Up to $250 the trade makes $13.50 a share, about 1.4 times the risk. Chasing at Monday’s close of $238.90 with the same stop means $12 of risk and 8 shares. The chart sets the stop, the stop sets the size (more in my post on where to put a stop loss), and the 1% stays the same from trade to trade, as I wrote in always use the same risk size.
There will be more news, another Foxconn number or the next AI headline. I wrote a long time ago that price makes news, not the other way around. The story will sound bullish as long as the stock holds above $235, and it will suddenly sound worried if it closes back below. I’d rather watch the levels.
FAQ
What is NVDA’s all-time high?
The record close is $238.90 on 5 October 2026, and the intraday high is $240.10 the same day. The previous record was the 14 May 2026 high of $236.54 (close $235.74), which held for almost five months.
What is the next support for NVDA?
The old record zone at $234.76–236.54, then the late-September shelf near $228, then the 50-day average at $218.92. A daily close back below $234.76 would mean the breakout has failed.
Where is the 200-day moving average for NVDA?
At $201.02 on 5 October, rising, and 15.9% below Monday’s close. The summer range low of $189.80 sits under it. NVDA closed below the 200-day only once since mid-May.
So I’m not guessing where NVDA tops. My question is whether $235 holds. If it does, the breakout works. If it doesn’t, the range comes back, and that is what the stop is for. If you want the same kind of levels for the S&P 500, Bitcoin and gold every Monday, they are on the weekly levels page.
Not financial advice. This is educational content, shared for information and entertainment only, and it is not a recommendation to buy or sell any asset. Backtests and past results do not guarantee future results, and the numbers or charts here may contain mistakes. Trading carries risk, including losing all the money you put in. Do your own research before you make any decision.