Earlier this year I posted a simple strategy on how to beat the S&P 500 index with market timing. I had done the backtest on 21 years of data in AmiBroker. I am now publishing the results of a backtest using the same strategy on the Nasdaq 100 index. The backtest was done in TradeStation on the ticker QQQ to compare buy-and-hold to market timing.
I’m doing the backtest since the year 2000 again, when the markets had a revolution and went electronic. Some readers may think that I cherrypicked the period when market averages were doing poorly to have advantage against the benchmark, but why would I want to exclude bear markets and only observe the long bull run?! Wouldn’t that be even more curve fitting the results and creating a bull market bias?! I definitely want to acknowledge that markets go up and down, that is to see how averages and strategies perform throughout the cycle.
Disclaimer: Historic returns do not guarantee future performance. I make no recommendations to buy or sell any assets. Each financial decision may lose some or all of the capital. Every person must understand risks involved and do their own research.
Nasdaq 100 Index (QQQ)
1.01.2000 – 10.12.2021
| Buy-and-hold | Market timing | |
| Capital | $10,000 | $10,000 |
| Ending value | $42,939 | $46,470 |
| Trades | 1 | 23 |
| Win rate | N/A | 39,13% (9) |
| Annual return | 6,86% | 7,24% |
| MaxDD | -86,22% (paper) | -43,72% |
The results are very similar to the S&P 500 index, which is a sign that the strategy is robust. Not only did the market timing approach beat absolute return, it did it with much less risk. Can you imagine seeing your portfolio lose 86% of its value, meaning a $10k account showing $1,4k left without knowing how long the recovery would take?! At the same time, having a “risk off” rule in the portfolio kept the maximum drawdown at 44%, not perfect but more tolerable than -86%. You’d think it was a one-time exception bottoming in 2003, but the buy-and-hold account was still showing -77% in late 2008 while the timing strategy was sitting in cash with a 6% drawdown from the last equity high of 2007.
Be mindful about the recovery period and what one could do with the capital when markets are in a downtrend. A fun fact – the longest time between equity peaks was 2766 days for the timing strategy, while the buy-and-hold investor had to wait for 5985 days to get a new equity peak!
Market timing rules
The rules of this market timing strategy are simple and it needs low maintenance once a month.
Buy: end-of-month price closes above 200-day MA, buy MKT on the next open.
Sell: end-of-month price closes below 200-day MA, sell MKT on the next open.
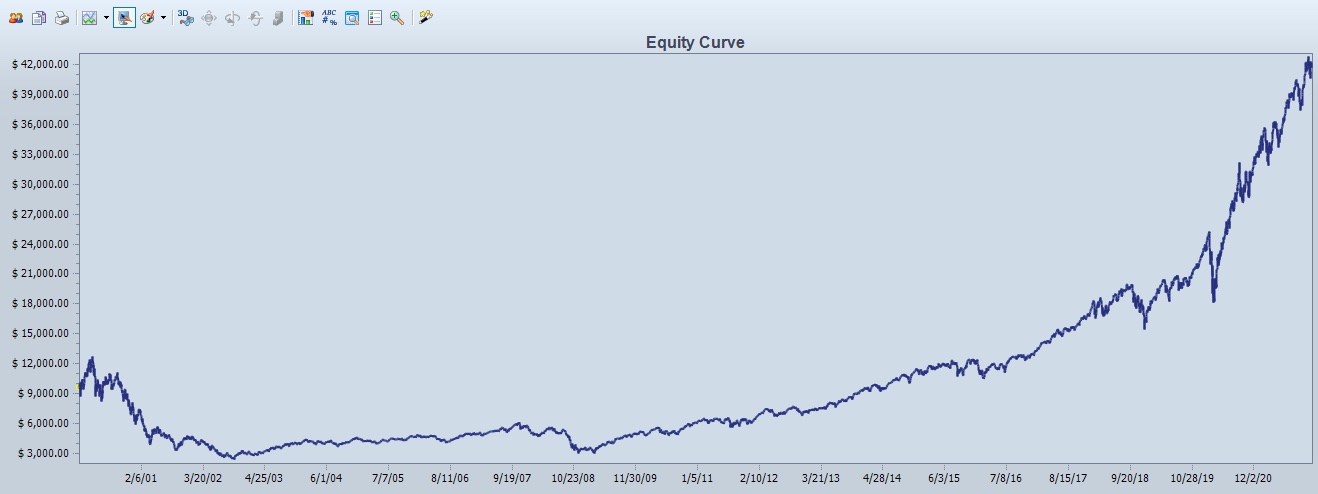
Equity curve
Buy-and-hold equity:
Market timing equity:
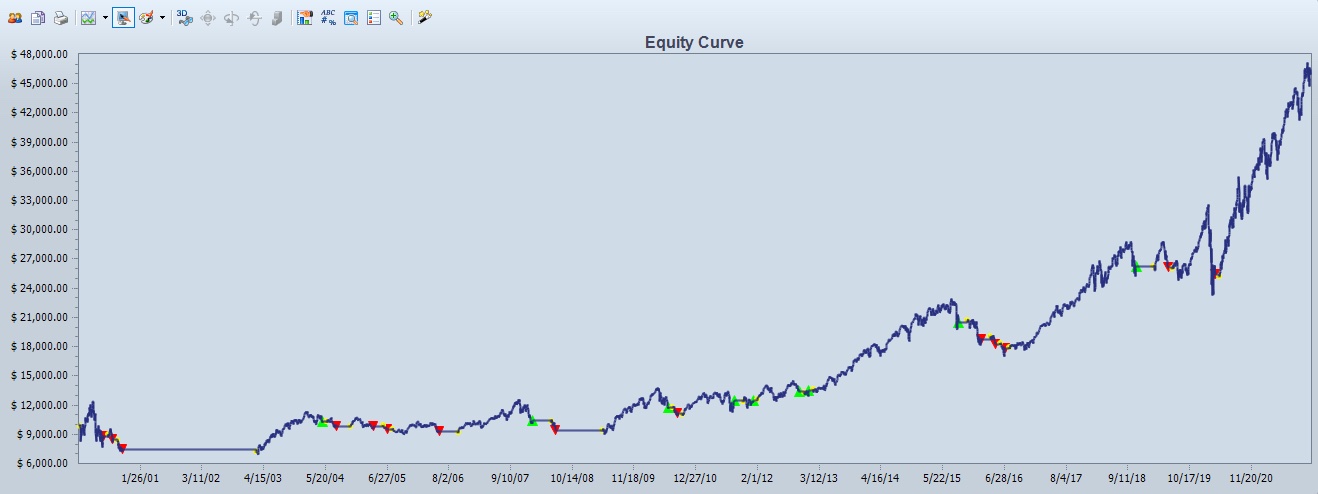
The equity curves above illustrate the point how the market timing strategy goes into cash in downtrends while the buy-and-hold investor has to tolerate whatever happens in a bear market. It’s easy to see the recovery in hindsight, but it’s much more difficult to experience a downturn in real time without knowing the depth and length of the drawdown.
Conclusion
Backtests do not show how the future will unfold. It does show how one or another approach would have statistically worked in the past to make assumptions of an expected edge going forward. Just like a fundamental investor looks at the past data to make decisions into the future, a technical quant does the same using a different set of data.
I’ll repeat my words from the other backtest post. This kind of trading is not for everyone. One needs to understand the odds, risks and psychology behind market timing. Nobody knows the future and I do not recommend taking a strategy from a blog or a book to blindly start trading it. Everyone needs to do their own research and validate a strategy. However, this post is to describe my mindset for preserving capital in possible bear markets.
Share this post
2 replies on “Timing the Nasdaq 100 index (QQQ)”
Suured tänud ka selle indeksi testimises. Huvitav oleks veel võrrelda, palju oleks olnud tootlus investoril, kes oleks iga kuu avamisel ostnud kindla summa eest indeksit.
Thanks for your comment, Andrus! I hope it’s fine if I reply in English so all readers can understand.
When backtesting a market that we know has eventually gone up, the result of adding more money will obviously be very positive. We know that Nasdaq 100 has gone up in hindsight, but if we test adding money to an index like the Japan’s Nikkei that was in a downtrend for 14 years, the end result will be different. We don’t know which market is going to trend up in the future, so testing upmarkets for buy-and-hold is not a reliable way to do it.
I would not remove risk management only because a market has gone up in the past. If I was adding money to the portfolio, I would still add it to the strategy that has a risk management mechanism built into it. Adding money hoping the trend will eventually be up is not something I would do. Using a trend filter to get out in possible bear markets will not have the bias of an uptrending future.
This is my opinion only and not investment advice of any kind.