Blog
How to read stock charts: A step-by-step guide on a real chart
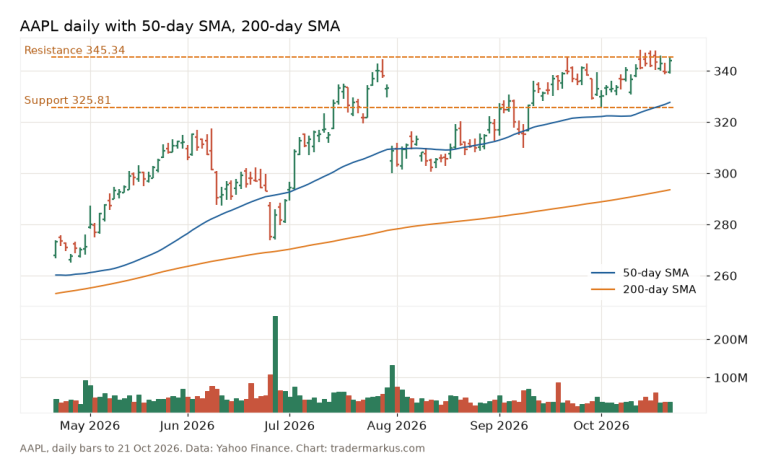
To read a stock chart, start with the time frame, then look at each bar’s open, high, low and close, then at the trend, the support and resistance…
Essays on trading psychology and method, chart reads and market notes, since 2018.
123 posts · page 5 of 21To read a stock chart, start with the time frame, then look at each bar’s open, high, low and close, then at the trend, the support and resistance…
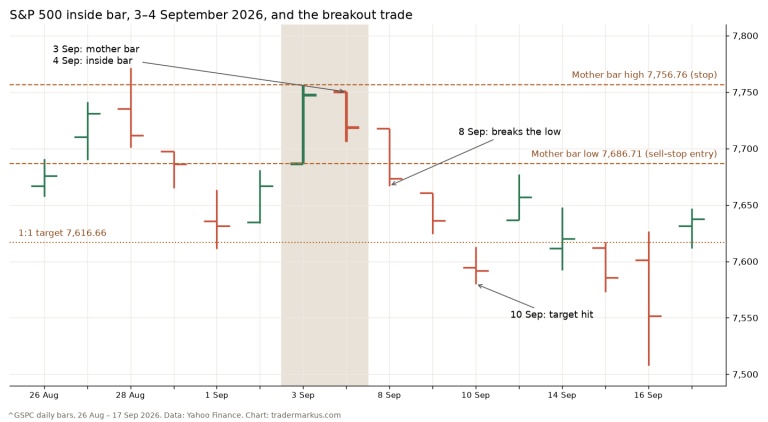
An inside bar is a bar whose high is lower and whose low is higher than the bar before it, so the whole day fits inside the previous one. Traders…
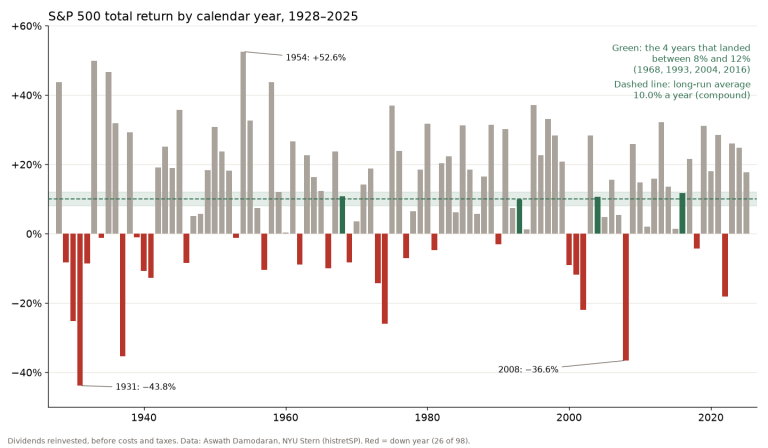
The S&P 500’s average return since 1928 is about 10% a year with dividends reinvested: 10.0% compounded over 98 calendar years, 1928–2025. Without…
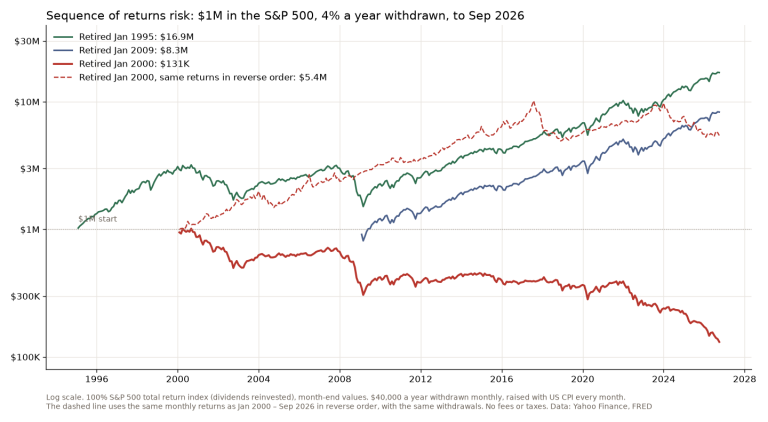
Sequence of returns risk is the danger that bad years come at the start of retirement, while you are taking money out. I ran it on real S&P 500 data…
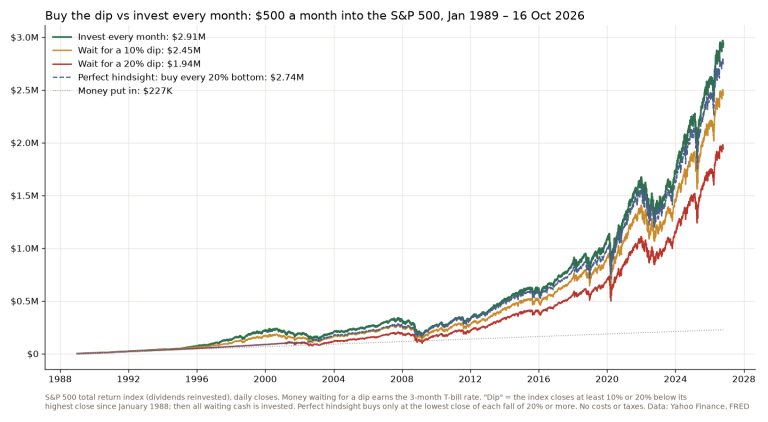
Buying the dip means keeping cash aside and investing it when the market falls. I tested it on the S&P 500 with dividends since 1989: $500 a month…
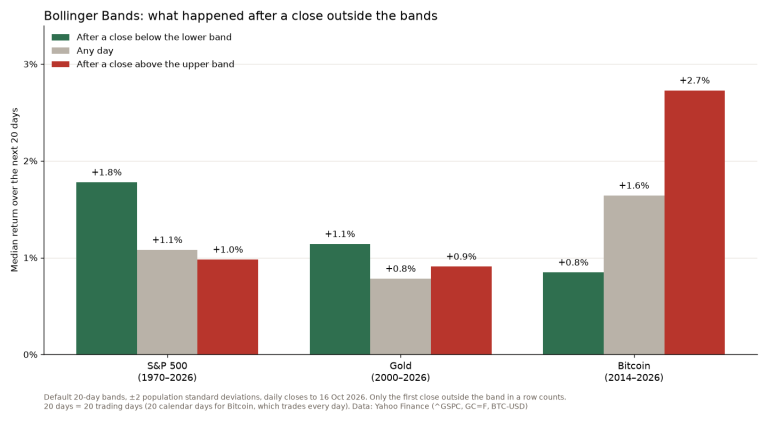
Bollinger Bands are a 20-day moving average with a band two standard deviations above and below it. I tested John Bollinger’s own rules on the S&P…
Type a word or a book title. Titles, excerpts and tags are searched.