Blog
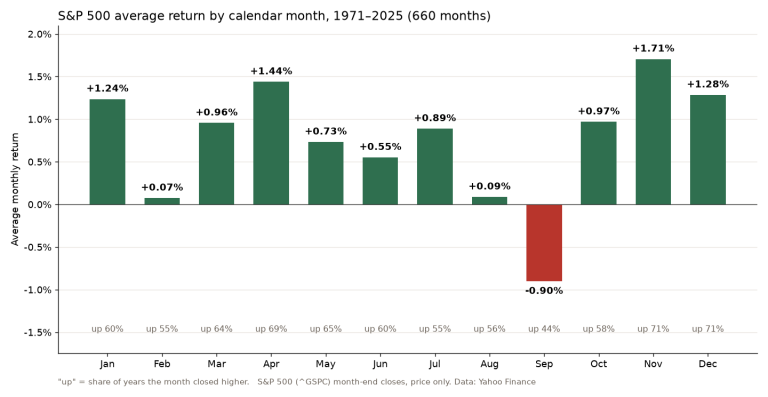
Worst month for stocks: What 55 years of S&P 500 data show
September is the worst month for stocks. From 1971 to 2025 the S&P 500 lost 0.90% in an average September and closed the month higher in only 44% of…
Essays on trading psychology and method, chart reads and market notes, since 2018.
96 posts · page 4 of 16September is the worst month for stocks. From 1971 to 2025 the S&P 500 lost 0.90% in an average September and closed the month higher in only 44% of…
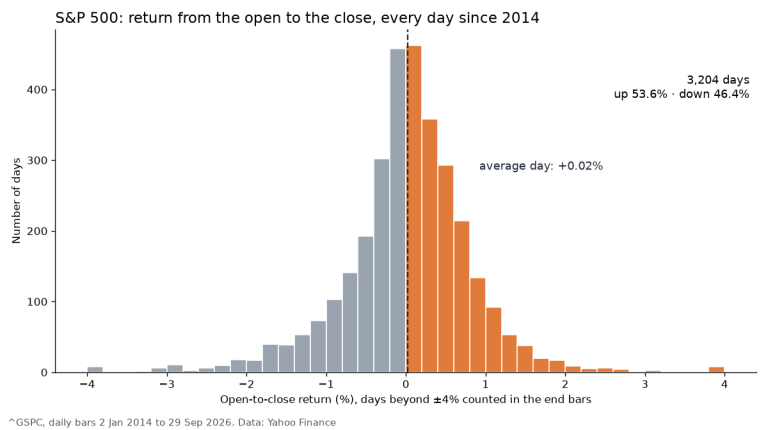
For most people who try it, day trading works like gambling: the expected result after costs is a loss. Two large studies of real accounts say so. In…
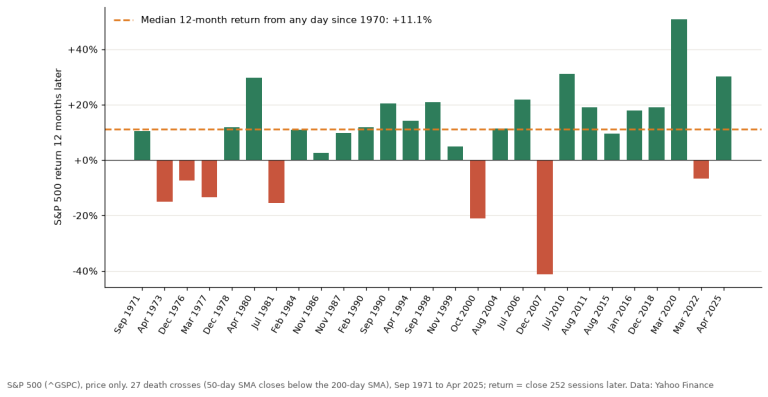
A death cross is when the 50-day moving average of a stock or index closes below its 200-day moving average. It sounds like the end of the world, and…
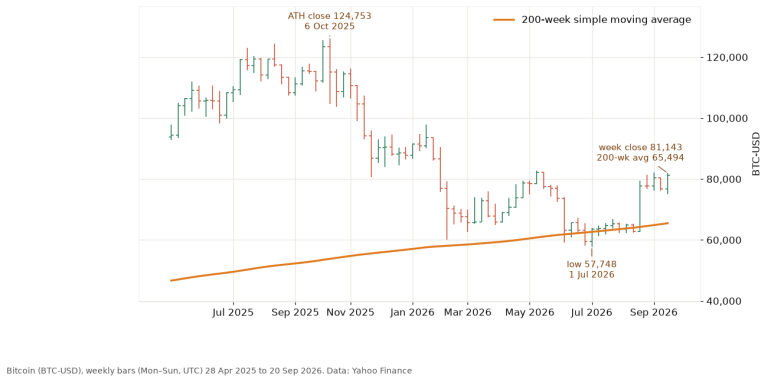
Bitcoin’s 200-week moving average is at about $66,200: the average of the last 200 weekly closes, up to the week that ended on 4 October 2026…
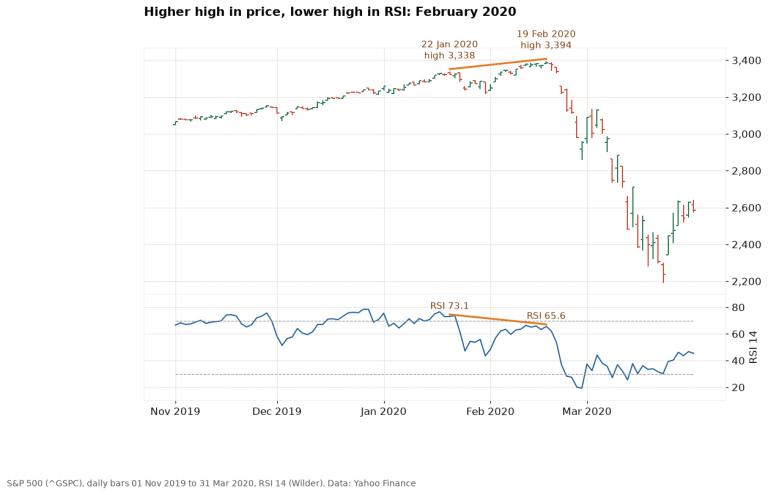
RSI divergence is when price and the Relative Strength Index disagree: price makes a higher high while RSI makes a lower high (bearish), or price…
Type a word or a book title. Titles, excerpts and tags are searched.