The best day of the week to buy stocks depends on which decades you look at, and for a long-term investor it barely matters. I checked every trading day of the S&P 500 since 1960. Monday was the worst day in the 1960s and 1970s and the best day in the last 10 years. Buying $100 every week since 2000 on your “best” day instead of your worst would have made a 0.33% difference by October 2026.
What is the best day of the week to buy stocks?
The usual answer you’ll find is “Monday, because prices tend to fall on Mondays”. That was true once. It hasn’t been true for a long time, and in the last 10 years Monday has been the strongest day of the week. No single day stayed best through every period I tested.
How I tested it
I used the daily closes of the S&P 500 index from Yahoo Finance, from January 1960 to 23 October 2026. For each trading day I took the change from the previous close and grouped the days by weekday. Monday’s change includes the weekend, because it’s measured from Friday’s close. This is the price index, so dividends aren’t included, but dividends don’t care which day you buy.
The Monday effect: real, then gone
| Day | 1960–1979, % | 2000–2026, % | Last 10 years, % |
|---|---|---|---|
| Mon | −0.139 | +0.023 | +0.084 |
| Tue | 0.000 | +0.059 | +0.062 |
| Wed | +0.083 | +0.035 | +0.077 |
| Thu | +0.046 | +0.033 | −0.002 |
| Fri | +0.078 | +0.007 | +0.065 |
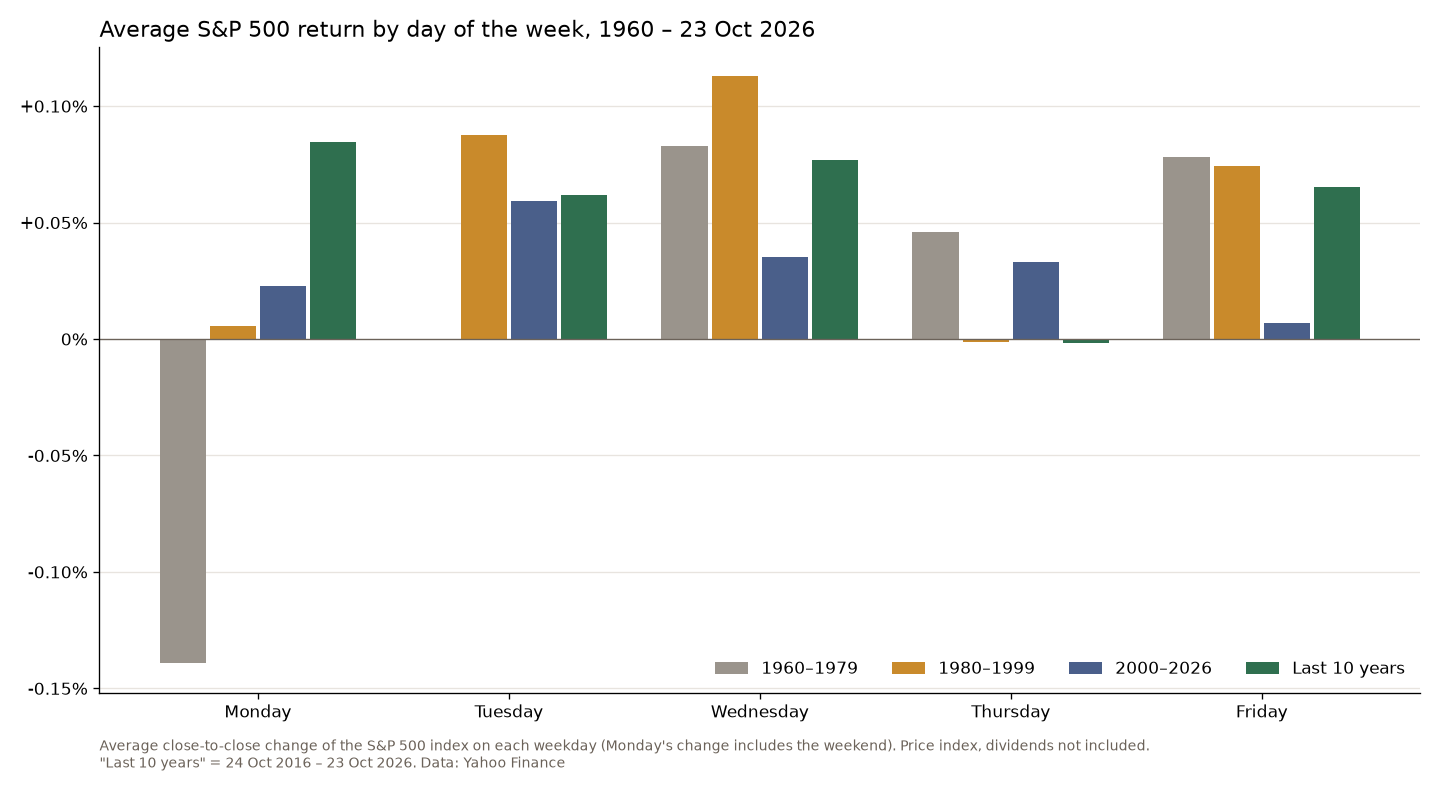
The table shows the average daily change. In 1960–1979 the S&P 500 closed higher than Friday on only 42.5% of Mondays. Every other day was flat or positive on average. Economists noticed this at the time: Frank Cross wrote “The Behavior of Stock Prices on Fridays and Mondays” in the Financial Analysts Journal in 1973, and Kenneth French’s “Stock returns and the weekend effect” followed in the Journal of Financial Economics in 1980.
Then it faded. In 1980–1999 Monday averaged +0.005%, about zero. Since 2000 it has been positive, and in the last 10 years (24 October 2016 to 23 October 2026) Monday was the best day of the week: +0.084% on average, higher on 59.1% of Mondays. Thursday was the weakest, at −0.002%.
That’s a common fate for a well-known market pattern. Once enough people know about a cheap day, buying it can take the discount away.
Does the day matter if you invest every week?
For an investor this is the practical question, so I tested it directly: $100 into the S&P 500 at the close of the same weekday every week, held to 23 October 2026. Mondays fall on holidays more often than other days, so the Monday investor makes fewer purchases. To compare fairly, I looked at what each dollar put in grew to.
- From 1960: each dollar grew to $36.99–$37.80 depending on the day. Monday was the best day to buy, because it bought the cheap Mondays of the 1960s and 1970s. The gap between the best and the worst day was 2.2% after 66 years.
- From 2000: $4.48–$4.49. The gap was 0.33%.
- Last 10 years: $2.05–$2.06, with Thursday on top. The gap was 0.49%.
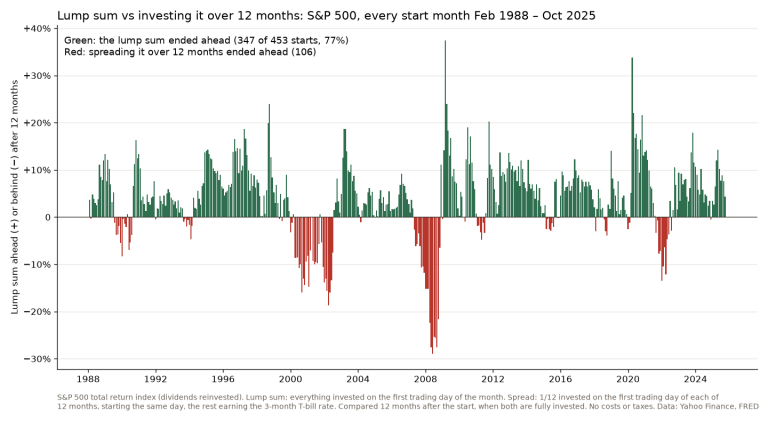
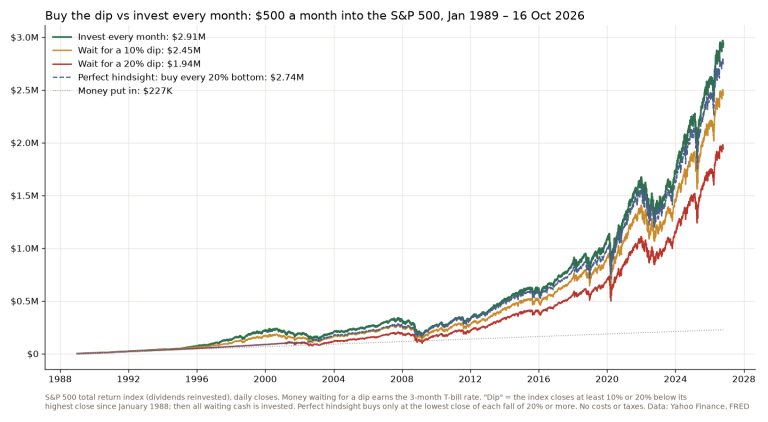
A fraction of a percent over decades is less than one ordinary day’s move: since 2000 the median daily move of the S&P 500, up or down, was 0.54%. Whether the money goes in at all, and how long it stays in, matters far more. My test of buying the dip found the same thing from another angle: waiting for a better moment cost money, and investing when the money was ready won.
Are stocks cheaper on Monday or Friday?
Not in any way you can use. In the 1960s and 1970s Monday’s close was usually below Friday’s, so Monday was the cheaper day. In the last 10 years Monday closed above Friday 59.1% of the time, so Friday was the cheaper day more often. The average Monday move was −0.14% then and +0.08% now, both small next to a typical day’s move of about half a percent.
What about the time of day?
A lot of the S&P 500’s gains come overnight, between one close and the next open. Since 2014, when Yahoo’s daily opening prices for the index become reliable, the index rose on average from the previous close to the open on every weekday, and most of Tuesday’s and Wednesday’s gains came overnight. For an investor this doesn’t change anything either. For a day trader it’s one more reason the odds are thin, which I looked at in Is day trading gambling?
What I do
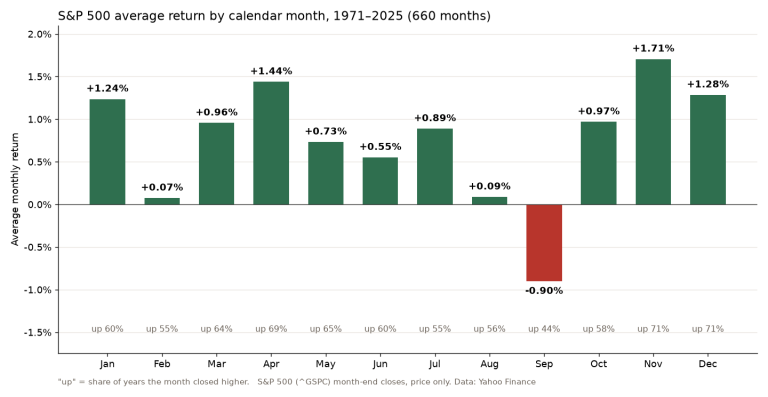
I treat the weekdays the way I treated the months. When I tested sell in May and go away, I didn’t find anything worth a seasonality filter in my trading system, and the market can do whatever it wants no matter what the current month is. The weekday pattern didn’t even keep its sign. For long-term money, the test above says to invest it when you have it, on any day. If you have a lump sum, my dollar cost averaging vs lump sum test is the more useful read. I also looked at the worst month for stocks, and that isn’t one I trade either.
FAQ
Which day of the week is best to buy stocks?
None reliably. On the S&P 500, Monday was the worst day in 1960–1979 and the best day in the last 10 years. For someone buying every week since 2000, the best and worst weekday ended 0.33% apart.
Is the Monday effect still real?
Not in the S&P 500. Monday averaged −0.139% a day in 1960–1979, about zero in 1980–1999, and +0.084% in the last 10 years, the best of the five weekdays.
What is the best time to buy stocks?
For a long-term investor, when you have the money. The weekday made almost no difference in my test, and waiting for a dip lost to investing every month in my buy the dip test.
The calendar is the easiest pattern to find in market data and one of the hardest to make money from.
Not financial advice. This is educational content, shared for information and entertainment only, and it is not a recommendation to buy or sell any asset. Backtests and past results do not guarantee future results, and the numbers or charts here may contain mistakes. Trading carries risk, including losing all the money you put in. Do your own research before you make any decision.