Do stocks go up on Fed days? I took all 261 scheduled FOMC decisions from February 1994 to September 2026 and checked how the S&P 500 closed on each announcement day. Until 2011 the answer was a clear yes: +0.34% on an average Fed day and 60% of them up, against +0.02% on other days. Since 2012 the edge is gone. Fed days have closed higher only 47% of the time, and in 2026 the index closed lower on all six.
The Fed announces its next decision on Wednesday, 28 October 2026, at 2:00 pm Eastern Time. Here is what the past decisions did, and why I wouldn’t trade the pattern that everyone quotes.
What is FOMC in trading?
The FOMC is the Federal Open Market Committee, the part of the Federal Reserve that sets the federal funds rate. It has twelve members: the seven Fed governors, the president of the New York Fed, and four of the other eleven regional Fed presidents, who rotate every year. It holds eight scheduled meetings a year, plus extra ones when something breaks, as in March 2020.
The statement comes out at 2:00 pm Eastern on the last day of the meeting, and the chair’s press conference follows. For traders, “FOMC” usually means that afternoon: the decision, the wording of the statement, and a market that can move a lot in a few minutes. The dates are on the Fed’s own calendar.
How I tested it
I collected the date of every scheduled FOMC announcement from the Fed’s meeting calendars and historical pages, from 4 February 1994, the first meeting after which the Fed announced its decision the same day, to 16 September 2026. That is 261 meetings. I left out conference calls and unscheduled meetings, because nobody can plan a trade around those.
For each one I took the S&P 500’s close-to-close change on the announcement day and compared it with all other days in the same years, leaving out the day before and the day after each meeting. Price index, no dividends, Yahoo Finance closes (Cboe’s closes give the same daily changes for 260 of the 261 days).
What the S&P 500 did on Fed days
| Period | Fed day | Other days |
|---|---|---|
| 1994–2026 (261) |
+0.23% 54% up |
+0.03% 54% up |
| 1994–2011 (144) |
+0.34% 60% up |
+0.02% 53% up |
| 2012–2026 (117) |
+0.10% 47% up |
+0.06% 55% up |
Average daily change and the share of days the index closed higher. The number in brackets is the number of meetings.
Over the whole period, Fed days look great on average. The S&P 500 rose from 480.71 on 3 February 1994 to 7,676.77 on 26 October 2026, about sixteen times its starting level, and 21% of that gain (measured in log returns) came on the 3% of days that were Fed days. Take those days out and the index would have grown about nine times instead.
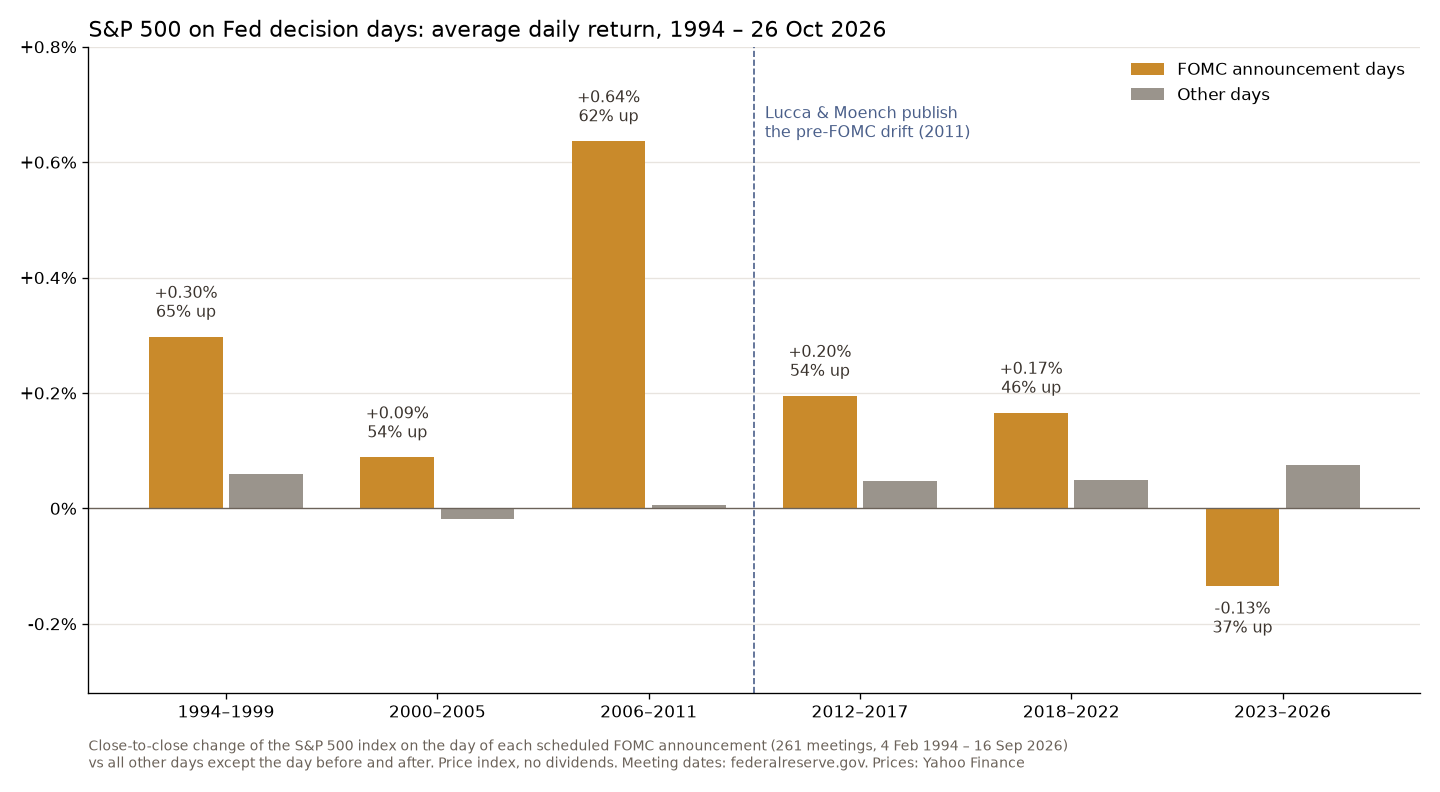
But the average hides the split. Before 2012 the median Fed day was +0.30%. Since 2012 it is −0.02%. The average since 2012 is still a little positive, +0.10%, only because a few big up days pull it up. On a typical Fed day you’ve had a coin flip, slightly tilted the wrong way.
The edge was found, and then it faded
This pattern has a name. In 2011 two New York Fed economists, David Lucca and Emanuel Moench, published a staff report called The Pre-FOMC Announcement Drift. They found that since 1994 the S&P 500 had risen 49 basis points on average in the 24 hours before scheduled FOMC announcements, and that this window accounted for about 80% of annual realized excess stock returns. Their sample ran to March 2011.
My numbers agree for those years. From 1994 to 2011, about half of the index’s price gain came on Fed days. From 2012 to today, it is 6%, on the same 3% of days. Their window ends just before the 2:00 pm announcement, while my daily closes include the reaction after it, so the two numbers aren’t the same measurement. The direction is the same.
Why did it fade? I can’t prove it. A widely read paper that tells everyone where an easy return is tends to get the return traded away, and the Fed itself has changed how it talks to markets. The data only show that it stopped, and in the last few years it has turned negative: from 2023 to September 2026, 30 meetings, an average of −0.13% and only 37% of Fed days up. In 2026 all six closed lower, from −0.01% on 28 January to −1.52% on 29 July. On 16 September, when the Fed raised its target range by a quarter point to 3.75–4%, the index closed 0.45% lower.
Thirty meetings is a small sample, and I wouldn’t build a short-the-Fed rule on it either. That’s exactly the mistake the 2011 paper invited: a strong pattern in the past, extended into a future that had other plans. I wrote about that trap in past performance is not indicative of future results.
The day before and the day after
The day before a Fed announcement was a little better than an ordinary day in both periods: +0.13% before 2012 and +0.12% since, against +0.02% and +0.06% on other days. That is close to what Lucca and Moench describe, since part of their 24-hour window falls on the day before. But the difference is about the size of the noise in 261 days, so I read it as “not worse than a normal day”, not as an edge. The day after was flat on average before 2012 and −0.10% since, with about half of the days up.
The biggest Fed days
The best was 16 December 2008, +5.14%, when the Fed cut its target to a range of 0 to 1/4 percent. The worst was 18 December 2024, −2.95%, on a day the Fed also cut, by a quarter point to 4.25–4.5%. Two cuts, two opposite reactions. The market reacts to the gap between what it expected and what it got, including the projections and the press conference, not to the decision on its own. That is also why Fed days move more: 0.85% on an average Fed day in either direction, against 0.77% on other days.
How I handle Fed days
I don’t try to predict the decision. Back in 2025 I wrote that “hot stock picks and predicting the FED’s next move sell so much better to the crowd”, and in my 2024 lessons I called fitting the Fed’s past decisions to today’s market a backtest with a sample too small to mean anything. Most of what gets said on a Fed day is the kind of noise I wrote about in Tune out the noise.
What the numbers say is simpler than the commentary. Fed days used to be some of the best days in the market, and for more than a decade they haven’t been. If you trade around the announcement, expect a bigger move than usual in either direction and size the position for it. If you invest, a Fed day is one of about 250 trading days in the year, and the calendar studies I’ve run, like the best day of the week to buy stocks, all end in the same place: the timing edges are small, and they come and go.
Not financial advice. This is educational content, shared for information and entertainment only, and it is not a recommendation to buy or sell any asset. Backtests and past results do not guarantee future results, and the numbers or charts here may contain mistakes. Trading carries risk, including losing all the money you put in. Do your own research before you make any decision.
FAQ
Does the stock market go up on Fed days?
From 1994 to 2011 it usually did: the S&P 500 closed higher on 60% of scheduled FOMC announcement days, with an average gain of 0.34%. From 2012 to September 2026 it closed higher on only 47% of them.
When is the next FOMC meeting?
The current meeting runs 27–28 October 2026, with the decision on 28 October at 2:00 pm Eastern. The next one is 8–9 December 2026, which also comes with the Fed’s Summary of Economic Projections.
Does the pre-FOMC drift still work?
Not in my data. The day before announcements has stayed slightly better than an average day, but the announcement day itself, which used to carry most of the gain, has had a median change of −0.02% since 2012.
What time is the Fed announcement?
The FOMC statement is released at 2:00 pm Eastern Time on the last day of the meeting. The chair’s press conference follows the same afternoon.