A Keltner channel is a 20-day exponential moving average with a line two average true ranges above it and two below. I tested it on 56 years of S&P 500 data and 12 years of Bitcoin. The S&P 500 closed inside the channel on 82% of days, and a close below the lower line was followed by better-than-normal returns, not worse. The classic breakout rule made 3.4% a year on the S&P 500 against 11.5% for holding. On Bitcoin it beat holding over the whole period, but only because of its first six years.
What is a Keltner channel?
It’s a band drawn around price. The version most charting platforms use today, and the one StockCharts’ ChartSchool describes, has three lines:
- Middle line: the 20-day exponential moving average of the close.
- Upper line: the middle line plus 2 × the 10-day average true range (ATR).
- Lower line: the middle line minus 2 × the 10-day ATR.
The idea is older than the formula. Chester Keltner, a Chicago grain trader, described a “ten-day moving average trading rule” in his 1960 book How to Make Money in Commodities: a 10-day average of the typical price, (high + low + close) ÷ 3, with lines one average daily range above and below, and a close outside the lines read as a signal to trade in that direction. Linda Bradford Raschke introduced the newer version, with an exponential average and ATR, in the 1980s. ATR measures how far price moves in a day, including gaps, so the channel widens when the market gets jumpy and narrows when it calms down.
Keltner channel vs Bollinger Bands
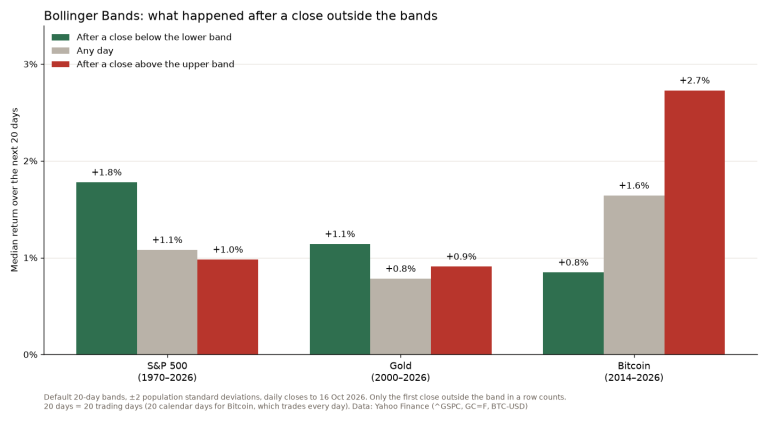
They look almost the same on a chart. The difference is how the width is set. Bollinger Bands use the standard deviation of closing prices, which reacts sharply to a few big closes. Keltner channels use ATR, which moves more smoothly. In my data that makes the Keltner channel the tighter of the two: the S&P 500 closed inside it on 82.4% of days, against 89.2% inside the Bollinger Bands. On Bitcoin it was 78.9% against 87.1%. I covered the Bollinger side of this, on the same markets, in what 56 years of data show about Bollinger Bands.
The two are also combined. John Carter’s TTM Squeeze (I reviewed his book Mastering the Trade) says volatility is unusually low when the Bollinger Bands sit completely inside the Keltner channel. I tested that below.
What happens after a close outside the channel
I took Yahoo Finance daily data for the S&P 500 index from 1970 and Bitcoin from September 2014, both to 26 October 2026, and looked at the next 20 trading days after the first close above the upper line and the first close below the lower line, against all days. I left gold out: Yahoo’s daily highs and lows for gold futures are unreliable before about 2020, with many days where the high equals the low, and ATR needs a clean range.
| Next 20 days | S&P 500 | Bitcoin |
|---|---|---|
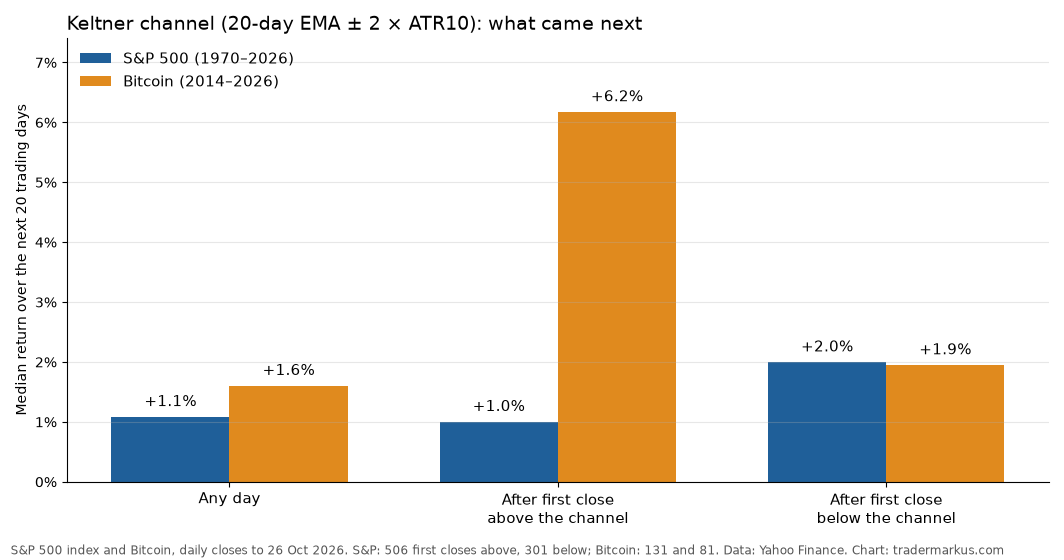
| Any day (median) | +1.1% | +1.6% |
| After first close above | +1.0% | +6.2% |
| After first close below | +2.0% | +1.9% |
The two markets behave differently. On the S&P 500 a close above the channel told you nothing (506 cases, median +1.0% against +1.1% for any day), while a close below it was followed by a better month than usual (301 cases, median +2.0%, higher 66% of the time against 61%). That is the opposite of the breakout reading. Bitcoin was the market where it worked as a breakout: after a first close above the upper line, the median 20-day return was +6.2% against +1.6% for any day, across 131 cases.
Keltner channel strategy: does the breakout rule work?
The textbook rule is to buy when the price closes above the upper line and sell when it closes back below the middle line. I tested exactly that, with no costs, the trade at the close, and cash earning the 3-month T-bill rate while out. For the S&P 500 the signals come from the index and the returns from the total return index (dividends included, from 1988), because a price-only index makes any timing rule look better than it is.
| Breakout rule | S&P 500 | Bitcoin |
|---|---|---|
| Per year | 3.4% | 57.5% |
| Buy and hold | 11.5% | 53.2% |
| Worst drawdown | −16.6% | −35.7% |
| Hold drawdown | −55.3% | −83.4% |
| Time in market | 32% | 31% |
On the S&P 500 the rule was a poor deal. It was out of the market two-thirds of the time and earned less than a third of buy and hold, in both halves of the period (3.6% vs 12.2% from 1988 to mid-2007, 3.1% vs 10.7% since). Wider or narrower channels didn’t rescue it: 1.5, 2 and 2.5 ATR all landed between 3.4% and 4.4% a year. The smaller drawdown is real, but you’d get a similar one far more cheaply by holding less stock.
Bitcoin is the interesting one. Over the full 12 years the rule made 57.5% a year against 53.2% for holding, with a worst drawdown of −35.7% instead of −83.4%, and it still came out ahead with 0.25% costs per trade. But split the period in half and the story changes. From September 2014 to September 2020 it made 87.7% a year against 69.9%. Since September 2020 it made 32.6% a year against 38.5% for holding. The edge on return came from the early, wilder years. What held up in both halves was the drawdown: never worse than about −36%, while holding lost more than three-quarters twice.
Does the squeeze predict a big move?
Not in this data. Using Carter’s settings as ChartSchool describes them (Bollinger 20, 2 inside the original Keltner channel with a 1.5 multiplier), the S&P 500 was in a squeeze on 13% of days. After 256 squeezes ended, the median move over the next 20 days, up or down, was 2.8%, against 2.7% for any day. Bitcoin’s was 8.3% against 8.8%. The direction told you nothing either: the S&P 500 was higher 20 days later 61% of the time, exactly the same as on any day. A quiet market stayed about as quiet as usual.
How I’d use a Keltner channel
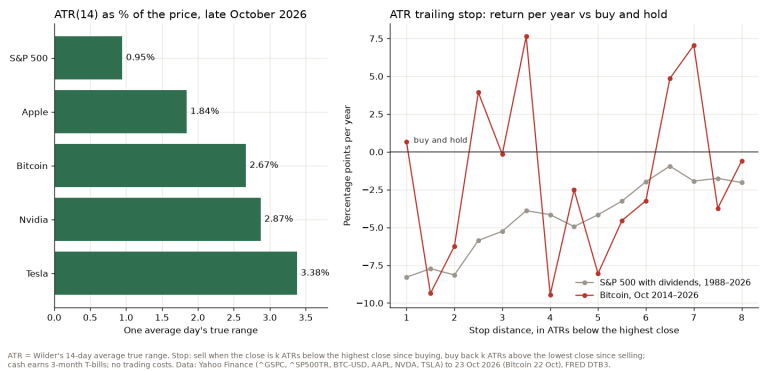
As a picture of how stretched price is, not as a signal on its own. On the S&P 500 the data says a close below the lower line is more often a dip than the start of a slide, which agrees with what I found for Bollinger Bands. That is not the same as saying waiting for dips pays: in my buy-the-dip test, investing every month beat waiting for a fall. On Bitcoin a close above the upper line has meant strength, but most of that came from 2014 to 2020, and I wouldn’t bet that the next six years look like those. Whatever you use it for, the channel width is ATR, so it also tells you how far away a sensible stop is. I wrote about that in where to put a stop loss.
FAQ
What are the best Keltner channel settings?
The common default is a 20-day EMA with 2 × ATR(10). In my tests the setting mattered less than the market: on the S&P 500 every multiplier from 1.5 to 2.5 lost badly to buy and hold, and a 20-day ATR instead of 10 changed its result by less than half a percentage point a year (on Bitcoin by under one point).
Is a Keltner channel better than Bollinger Bands?
Neither is better at predicting. The Keltner channel is tighter and smoother because ATR moves more slowly than standard deviation, so price touches it more often. On the S&P 500 both said the same thing: closes below the lower line were followed by better-than-average months.
Is the Keltner channel a leading or lagging indicator?
Lagging. Both the moving average and the ATR are built from past prices, so the channel describes where price has been and how much it has been moving. It can’t know a move is coming.
A channel tells you when price is unusual. Whether unusual means “keep going” or “come back” depends on the market, and on the S&P 500 it has mostly meant come back.
Not financial advice. This is educational content, shared for information and entertainment only, and it is not a recommendation to buy or sell any asset. Backtests and past results do not guarantee future results, and the numbers or charts here may contain mistakes. Trading carries risk, including losing all the money you put in. Do your own research before you make any decision.