Max pain is the strike price where option holders would collect the least at expiry, and the theory says the stock gets pulled toward it before expiry. I tested it on 30 heavily traded US stocks and ETFs over the 23 and 30 October 2026 expiries. On the two expiry days, 20 of 60 closes finished nearer max pain than the day before, and 22 finished nearer a placebo level I made up. In my sample max pain pulled nothing.
What is max pain in options?
Max pain is the price at which the options on a stock would pay their holders the least money if they all expired right there. Every call is worth something at expiry if the price is above its strike, every put if the price is below its strike. Somewhere in between there is a price that leaves the most options worthless, and that price is called max pain, or the maximum pain point.
The theory behind it goes like this: the people who sold those options, mostly market makers, would like as many of them as possible to expire worthless, and in the days before expiry their hedging pushes the price toward that level. If that were true, max pain would be a free forecast of where a stock closes on Friday. That is a claim you can test, which is what I did.
How max pain is calculated
You need the open interest, the number of contracts still open, for every strike of one expiry date. Then, for each strike as a possible closing price, you add up what all the calls and puts would be worth at that price. The strike with the smallest total is max pain.
Here is the real thing for SPY’s options that expire on Friday, 30 October 2026, from Cboe’s delayed quotes on the evening of 27 October, when SPY closed at $769.66:
| If SPY closes at | Holders get paid |
|---|---|
| $755 | $409 million |
| $760 | $357 million |
| $765 | $338 million |
| $770 | $362 million |
| $775 | $416 million |
Value at expiry of all open SPY options for 30 October, 100 shares per contract. Open interest from Cboe on 27 October.
So SPY’s max pain for that Friday was $765, about 0.6% below the close. Notice how flat the bottom is: between $760 and $770 the total changes by less than a tenth. Max pain is the lowest point of a shallow bowl, not a sharp target. Also notice what sits behind it: 1.6 million put contracts against 0.64 million calls for that one expiry, many of them hedges far below the price, like 151,574 puts at the $570 strike. Those far-away puts pay nothing at any of these prices, but they still count in the open interest that people quote.
How I tested it
I took 30 of the most traded US option names: SPY, QQQ, IWM, AAPL, MSFT, NVDA, TSLA, AMZN, META, GOOGL, AMD, NFLX, PLTR, GME, AMC, COIN, MSTR, SMCI, AVGO, BA, JPM, XOM, DIS, UBER, SOFI, HOOD, MU, INTC, F and BAC. Every weekday morning from 23 to 30 October I saved Cboe’s delayed option quotes for all of them, the same free data I used when I tested the poor man’s covered call. Open interest in a morning file is the count at the previous close, so each file gives max pain as of one close. Closing prices came from Yahoo Finance, and all 30 closes for 30 October match Cboe’s to the cent.
The test itself is simple. If max pain pulls, the expiry close should end nearer max pain than the starting close more often than not. The catch is that markets trend: in a falling week every stock gets nearer a max pain that sits below it, magnet or no magnet. So I also counted a placebo, a “mirror point” at the same distance on the other side of the starting close. A real magnet should beat its mirror. If it’s noise, the two come out about even. As a third check I took SPY’s move out of every stock’s move and looked again.
What the data showed
Start with the expiry day itself, where the pinning is supposed to be strongest. On Friday 23 October, 10 of the 30 closed nearer their max pain than on Thursday, and 13 closed nearer the mirror point. The median distance from max pain went from 2.48% to 3.09%, so on average prices moved away from it. On Friday 30 October it was 10 of 30 nearer max pain and 9 nearer the mirror. Two expiry days, 60 closes: 20 for max pain, 22 for the placebo.
Then the whole week before the 30 October expiry. I calculated max pain from each close between Thursday 22 and Thursday 29 October, six starting points, and checked where each name finished on the Friday:
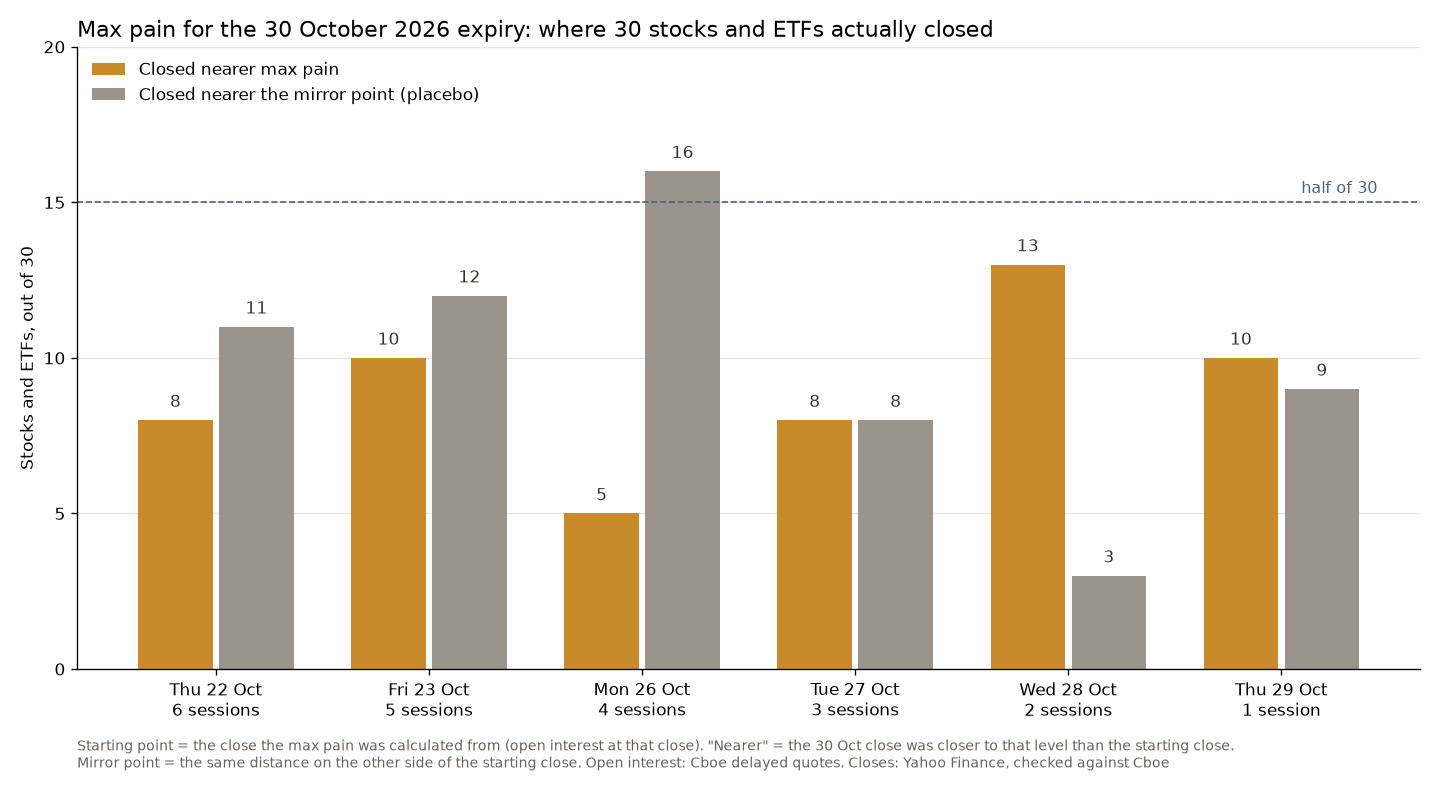
Max pain never got more than half. The best was 13 of 30 from the 28 October close, the worst 5 of 30 from 26 October. The mirror placebo won three of the six, max pain two, and one was a tie. Taking the market out didn’t rescue it either: from the 22 October close, only 7 of 29 moved toward max pain once SPY’s move was subtracted. From that close the median distance from max pain grew from 4.08% to 7.51%, because it was a rough week. SPY lost 1.8% on the Friday alone, from $769.36 to $755.72, and Intel’s max pain was $99 at the 22 October close while Intel itself went from $85.49 to $65.76.
The SPY example from the table above ended the same way. Max pain was $765 with SPY at $769.66 on 27 October. On expiry day SPY closed at $755.72, $9.28 below max pain. SPY, QQQ and IWM also have options expiring every weekday, so I checked those same-day expiries too: 18 of them in six days, 5 closed nearer max pain and 8 nearer the mirror.
Now the honest part. This is one week, 30 names and two weekly expiries. The six starting points share the same Friday closes, so they are not 180 separate tests. I wouldn’t claim from this that max pain pushes prices away either. What the week shows is that max pain was no forecast, and that a level I made up by flipping it to the other side did just as well.
Is max pain reliable?
There is real research on prices sticking to strikes at expiry, and it is worth reading what it does and doesn’t say. Sophie Ni, Neil Pearson and Allen Poteshman published “Stock price clustering on option expiration dates” in the Journal of Financial Economics in 2005. They found that on expiration dates the closing prices of stocks with listed options cluster at strike prices, and they estimated that this moved returns by at least 16.5 basis points per expiration date, about $9 billion of market value. They put it down to market makers rebalancing their hedges and to some traders pushing prices on purpose.
That is clustering at strikes, which is a smaller claim than max pain. A stock can finish exactly on a strike without that strike being the max pain level, and a pull of a fraction of a percent on one day doesn’t make max pain a forecast for the week. My counts fit that reading: on the two expiry days the closes ended nearer max pain less often than nearer the placebo, so whatever pinning happens at strikes, it didn’t show up as a pull toward max pain.
So I’ll keep reading open interest for what it is: a map of where the positions sit. As a target for Friday’s close, max pain did about as well as a number I invented by flipping it to the other side of the price. I can do that for free, without downloading an option chain.
FAQ
How do I calculate the maximum pain of options?
Take the open interest at every strike for one expiry. For each strike as a closing price, add up what every call and put would be worth there. The strike with the smallest total is max pain. The SPY table above is that calculation for 30 October 2026.
What is the maximum pain for S&P 500 options?
It changes every day as positions open and close, and every expiry has its own. For SPY’s 30 October 2026 expiry it was $765 on the evening of 27 October, with SPY at $769.66.
What is the max pain for QQQ today?
On the evening of 27 October 2026, QQQ’s max pain for the 30 October expiry was $722, with QQQ at $721.25. Any number like this is out of date the next morning, so check it on the day, and don’t treat it as a target: QQQ closed that Friday at $690.49, $31.51 below it.
Is max pain reliable?
Not as a forecast, on my data. Over two weekly expiries, 20 of 60 expiry-day closes finished nearer max pain than the day before, against 22 nearer a placebo level. From six starting points in the week before 30 October, max pain never had more than 13 of 30 right. It is one week of data, so take it as a check, not proof.
Not financial advice. This is educational content, shared for information and entertainment only, and it is not a recommendation to buy or sell any asset. Backtests and past results do not guarantee future results, and the numbers or charts here may contain mistakes. Trading carries risk, including losing all the money you put in. Do your own research before you make any decision.