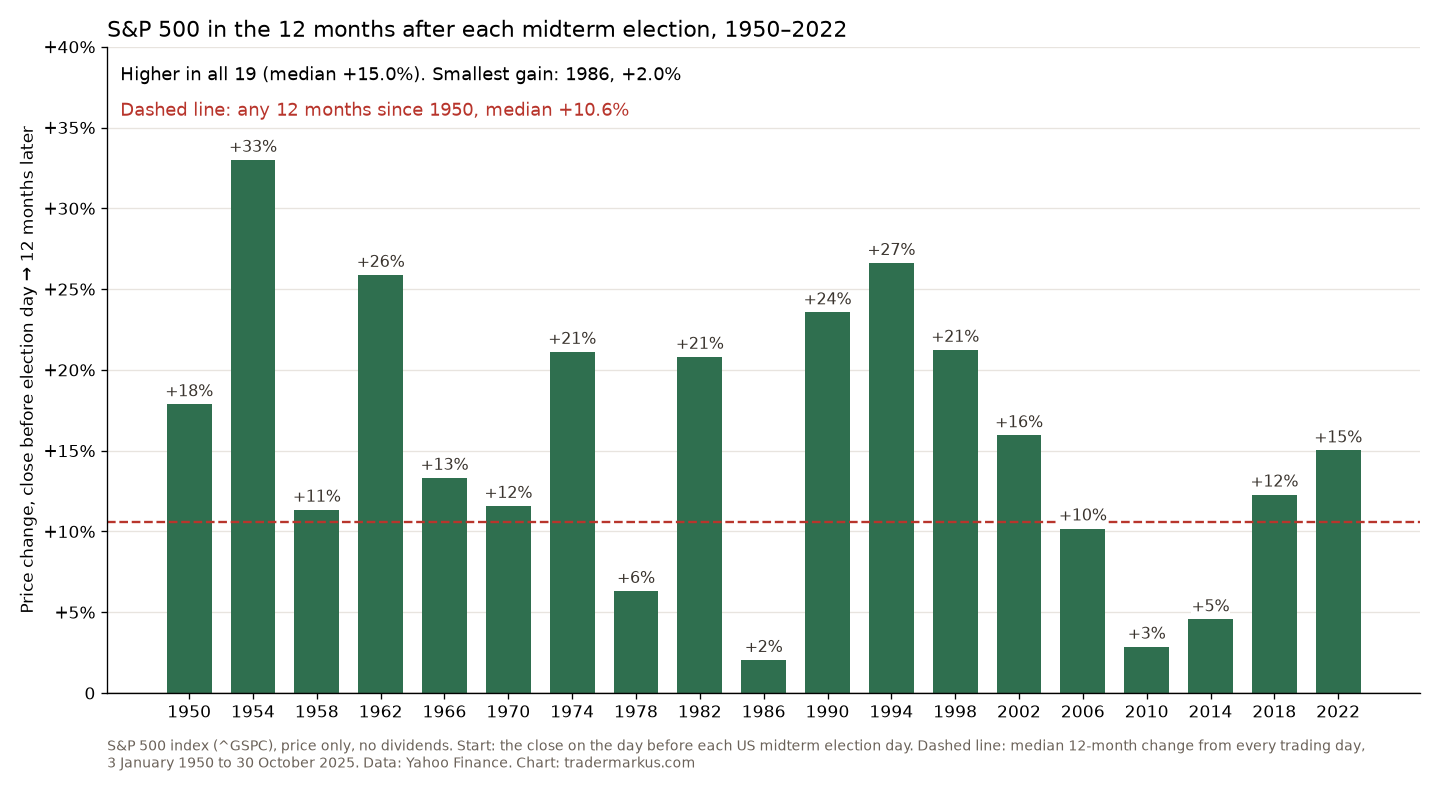
The US midterm elections are on Tuesday, 3 November 2026. I looked at what the S&P 500 did after every midterm since 1950. Twelve months after the close on the day before the vote, the index was higher all 19 times, by a median of 15.0%. Any 12 months since 1950 gave a median of 10.6% and were higher only three times out of four. The midterm year itself was usually the weak one. This year hasn’t been: the index was up 10.7% for 2026 by 30 October.
How does the stock market do after midterm elections?
I used the S&P 500 index from Yahoo Finance, daily closes from January 1950 to 30 October 2026. It is the price index, so dividends are not included. For each midterm from 1950 to 2022 I started at the close on the day before election day and measured the change 3, 6 and 12 months later. To compare, I measured the same thing from every trading day since 1950.
| After | Midterms | Any day |
|---|---|---|
| 3 months | +8.0% 17 of 19 |
+2.7%, 67% |
| 6 months | +16.9% 19 of 19 |
+5.2%, 71% |
| 12 months | +15.0% 19 of 19 |
+10.6%, 75% |
The median change and how many of the 19 midterms were higher. “Any day” is the median from every trading day since 1950 and how often it was higher.
The smallest 12-month gain was 1986, +2.0%, and that window ended two weeks after the October 1987 crash. The biggest was 1954, +33.0%. The last one, 2022, made +15.0%. Only two of the 19 were lower three months later: 2002 (−5.3%), when the bear market had not finished yet, and 2018 (−0.5%), when the December sell-off came in between.
Is it the election, or the four-year cycle?
An election doesn’t have to be the reason. The 12 months after a midterm cover most of the third year of a presidential term, the pre-election year, which the Stock Trader’s Almanac, founded by Yale Hirsch, has long called the strongest year of the four. So I ran the same test from the same early-November date in every year since 1950 and sorted the results by year of the term.
| Year | Median | Worst |
|---|---|---|
| Midterm year | +15.0% 19 of 19 |
+2.0% (1986) |
| Year 3 of the term | +9.1% 17 of 19 |
−33.0% (2007) |
| Election year | +8.3% 13 of 19 |
−21.9% (2000) |
| Year 1 of the term | +4.0% 10 of 18 |
−28.8% (1973) |
The 12-month change from early November: the median, how many years were higher, and the worst year.
The midterm start stands out from the other three, and it is the only one without a losing year. Across all 75 years the median was +10.8%, and 59 of them were higher.
The midterm year itself is often weak
The good part comes after the vote. The calendar years with a midterm in them, from 1954 to 2022, had a median return of only +0.6%, and 10 of 18 ended higher. 1974 lost 29.7%, 2002 lost 23.4% and 2022 lost 19.4%. Election years did much better, with a median of +11.8% and 16 of 19 up.
Part of the strong 12 months that followed was simply a recovery from that weakness. In 18 of the 19 midterm years the index made its low for the year before election day, often in the autumn: October in 1966, 1974, 1990, 2002 and 2022. The exception was 2018, which bottomed on 24 December.
2026 doesn’t fit the pattern. The S&P 500 started the year at 6,845.50, fell to 6,343.72 on 30 March and closed at 7,580.07 on 30 October, up 10.7% for the year and 3.1% below its high of 6 October. A midterm year that is already up double digits isn’t the usual starting point.
How much should you trust 19 out of 19?
More than most calendar patterns, and still not much. If each of the 19 had just been a random 12-month period, with the 75% chance of being higher that any 12 months had, getting all 19 right would happen about 0.4% of the time. That makes it hard to call it pure luck.
But it is 19 data points over 76 years. The edge also depends on the exact start. When I moved the start one week later, 1986 turned into a 2.9% loss and the record became 18 of 19. And the pattern is no secret. It gets repeated in the financial press before every midterm, so some of it may already be in the price before the vote. It is the same story as sell in May and go away and the worst month for stocks: a real tendency, small next to the noise in any one year.
What I do with it
Nothing, in terms of trading. My signals come from price, not from news or the calendar, and I wrote years ago that price makes news, not the other way around. After the vote there will be plenty of stories about what the result means for stocks. Most of them will be explanations fitted to whatever the market did that day.
What the numbers do say is that an election is a bad reason to sell. Since 1950, someone who sold before a midterm because of what might happen missed a year that went up every single time. If you are investing for the long run, the vote on Tuesday is not a reason to change your plan, whichever way it goes.
FAQ
Does the stock market go up after midterm elections?
Since 1950 it always has over the following 12 months. The S&P 500 was higher one year after all 19 midterms, by a median of 15.0%. Over three months it was higher 17 times out of 19.
What did the stock market do after the 2022 midterms?
The S&P 500 closed at 3,806.80 on 7 November 2022, the day before the vote. Three months later it was up 8.0%, and a year later up 15.0%, after falling 19.4% in 2022 as a whole.
Is 2026 a midterm year?
Yes. The midterm elections are on 3 November 2026. By 30 October the S&P 500 was up 10.7% for the year, far better than the median midterm year of +0.6%.
Are election years good for the stock market?
Presidential election years have been: a median of +11.8% since 1952, with 16 of 19 up. Midterm years have been the weakest of the four-year cycle, with a median of +0.6%, but the 12 months after the midterm vote have been the strongest.
Since 1950, anyone who sold before a midterm and stayed out for a year missed a gain every time. On Wednesday I’ll be looking at the price, not the results.
Not financial advice. This is educational content, shared for information and entertainment only, and it is not a recommendation to buy or sell any asset. Backtests and past results do not guarantee future results, and the numbers or charts here may contain mistakes. Trading carries risk, including losing all the money you put in. Do your own research before you make any decision.