A cup and handle is a bullish continuation pattern: after a rise, the price builds a rounded, U-shaped base (the cup), pulls back a little near the old high (the handle), and then breaks out above the handle on rising volume. William O’Neil made it famous in How to Make Money in Stocks. The textbook target is the depth of the cup added to the breakout price.
What is a cup and handle pattern?
It has two parts, and the names describe the shape. The cup forms after a stock has already been going up: it pulls back, spends weeks or months going sideways at the bottom, and climbs back to roughly where the fall started. Then, just under that old high, it pauses once more and drifts a little lower for a week or a few. That small pullback is the handle. The buy signal is the break above the top of the handle.
StockCharts’ ChartSchool credits the pattern to O’Neil and his 1988 book. When I reviewed that book, I summed up his 100 winning charts in one sentence: price breaks out to a new high on growing volume from a narrow sideways base. The cup and handle is the most common shape that base takes.
What are the rules for a cup and handle?
ChartSchool’s version is as specific as it gets, so I use it as the checklist:
- There has to be a rise before the cup, ideally a few months old. It is a continuation pattern, so it needs something to continue.
- The bottom should be rounded, a U. A sharp V-shaped low is too quick a reversal to count.
- The cup should give back a third or less of the rise before it, up to a half in volatile markets.
- The handle is a short pullback after the cup’s right side, ideally one to four weeks, that gives back no more than a third of the cup’s rise.
- Volume should increase substantially on the breakout above the handle.
- The target is the cup’s depth, from its bottom to its right-side high, added to the breakout price.
The stop most traders use is under the handle’s low. If the price falls back through the handle, the base has failed.
A real example: Lam Research in 2023
Lam Research (LRCX) is a good one because it ticks almost every box. Prices here are adjusted for Lam’s 10-for-1 split in October 2024, so they are a tenth of what you would have seen on the screen at the time.
The stock rose from a 31.50 close in October 2022 to 54.10 on 2 February 2023. That was the left side of the cup. It then slid to 47.70 by 13 March, a cup 6.40 deep, or 28% of the rise before it, inside the one-third rule. It spent two months coming back and reached 52.98 on 5 May. The handle took five trading days and bottomed at 51.58. On 15 May it closed at 55.23, above both sides of the cup.
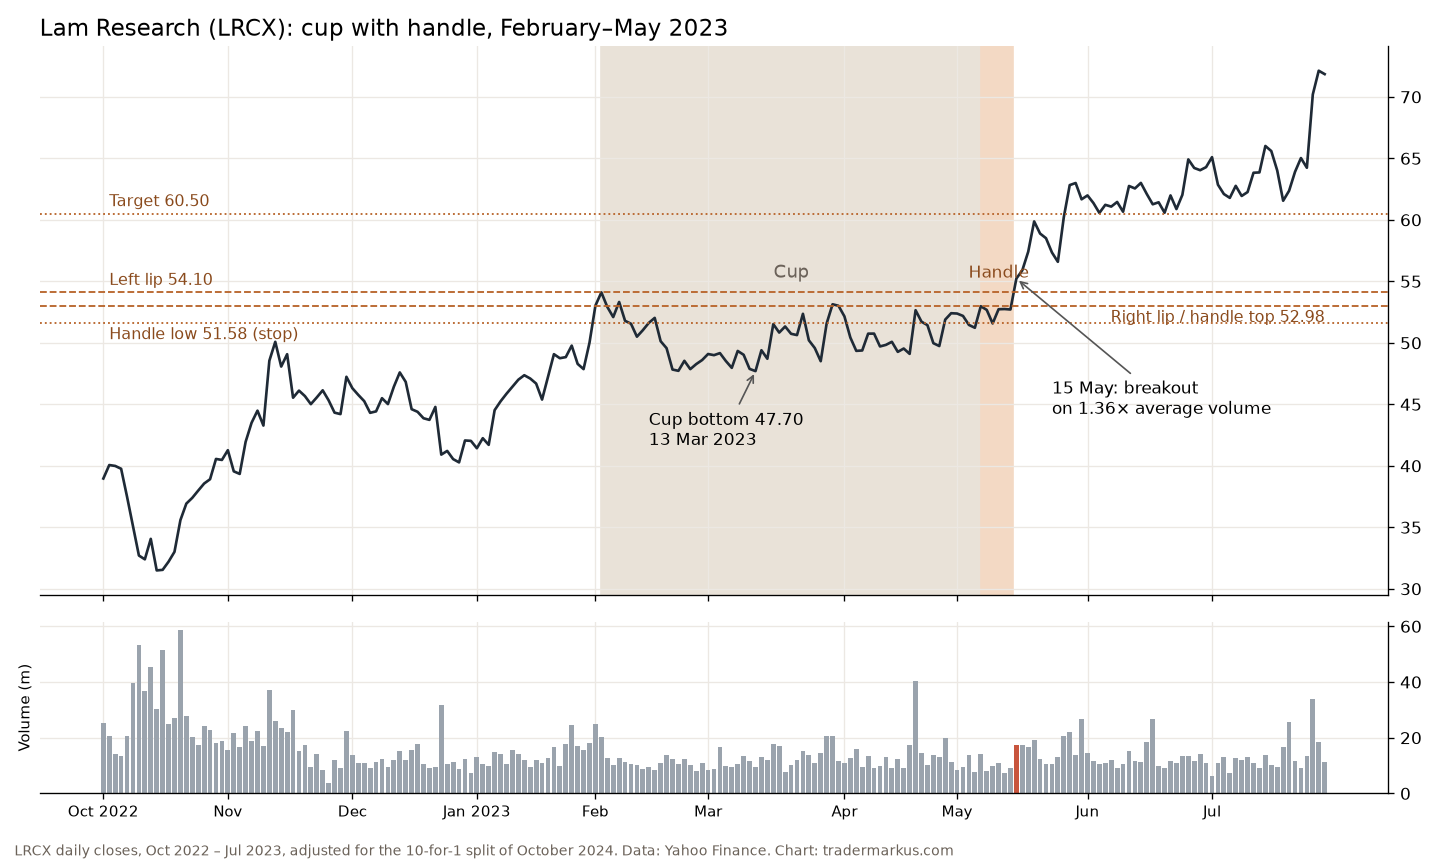
The target was the cup’s depth from the right side, 52.98 minus 47.70, added to the breakout: 60.50. The stock closed above it on 26 May, nine trading days later, and its lowest close in between was 55.89, nowhere near the 51.58 stop. By the end of July it was above 70.
One box it only half ticks: volume on the breakout day was about a third above its 50-day average. That’s an increase, but not the surge the textbook asks for. The example worked anyway, which tells you how much weight a single rule like that really carries.
Is the cup and handle pattern bullish?
In theory, yes: it is a pause in an uptrend, and the breakout says the trend has resumed. In practice the honest answer is that it depends on who draws it. Even ChartSchool says that capturing the pattern’s essence matters more than the particulars, which is another way of saying two traders will disagree about whether a given chart has one.
I saw that myself when I wrote the rules above down as code and ran them on the S&P 500 since 1990. They found only a handful of cups in 36 years, and when I looked at them on the chart, two were shapes I wouldn’t call a cup at all. A broad index is too smooth to print the pattern often; it belongs to single stocks. A double top, by contrast, shows up often enough on the index to test: I found 22 on the S&P 500 since 1970 and wrote up what happened after them. And testing it on single stocks properly needs data that includes the companies that went bust, which free data doesn’t. So I can show you a clean one, but I can’t give you an honest success rate.
That is also what bothered me in O’Neil’s book. Next to his winners I could see very similar price and volume action elsewhere on the same charts that didn’t work out. A pattern picked after the fact always looks better than one you have to act on before you know the ending.
How I use it
I don’t buy a pattern because I like its shape. But the idea under the cup and handle, a stock that has gone sideways, absorbed the sellers and then breaks out to new highs, is close to how I think about momentum. Nicolas Darvas traded the same idea with his boxes, and Mark Minervini’s volatility contraction pattern is a tighter version of it.
What the pattern gives you for sure is a place for the stop: under the handle. That keeps the loss small when the breakout fails, and breakouts do fail. Size the trade from that distance, as in stop loss trading, not from how good the chart looks.
FAQ
How long does a cup and handle take to form?
ChartSchool puts the cup at one to six months on a daily chart, longer on weekly charts, and the handle at one week to many weeks, ideally one to four. The Lam Research cup took about three months and the handle five trading days.
What is the target for a cup and handle?
The depth of the cup, measured from its bottom to the right-side high, added to the breakout price. In the LRCX example that was 52.98 minus 47.70, or 5.28, added to the 55.23 breakout close.
What is an inverted cup and handle?
The same shape upside down, read as a bearish pattern: a rounded top, a small bounce, then a break lower. The same cautions apply: it is just as easy to draw after the fact.
A cup and handle is a good way to find a stop. Whether the breakout works is up to the market.
Not financial advice. This is educational content, shared for information and entertainment only, and it is not a recommendation to buy or sell any asset. Backtests and past results do not guarantee future results, and the numbers or charts here may contain mistakes. Trading carries risk, including losing all the money you put in. Do your own research before you make any decision.