The inverse head and shoulders is the bullish twin of the head and shoulders top: three lows, the middle one deepest, and a close above the neckline is supposed to start a rise. I wrote it down as fixed rules and found 57 of them on the S&P 500 since 1970. Sixty trading days after the breakout the index was higher in 37 of them, with a median gain of +1.78%, against +2.65% for any day. Gold showed no edge either, and on Bitcoin the breakouts did worse than an average day.
The pattern is in every chart book, always with a clean example and an arrow pointing up. A computer doesn’t pick the nice ones, so this is what happens when the same rules find all of them.
What is an inverse head and shoulders pattern?
It is a bottom made of three lows. The left shoulder is a low, the head is a deeper low, and the right shoulder is a higher low at roughly the level of the left one. The highs between them form the neckline. The textbook signal is the first close above that line, and the textbook target is the distance from the head up to the neckline, added on top of the breakout. Another name for it is a reverse or inverted head and shoulders.
It is the same pattern as the head and shoulders top, turned upside down, so I used the same rules, turned upside down too.
How I tested it
I used daily closes of the S&P 500 from 1970, gold futures from 2000 and Bitcoin from 2014, all to 13 November 2026. The rules:
- A swing low is the lowest close of the 11 days around it, so it is only known 5 days later.
- The head is at least 3% below both shoulders, the two shoulders are within 5% of each other, and each part of the pattern takes 5 to 80 trading days.
- The neckline is the line through the highest close between the left shoulder and the head and the highest close between the head and the right shoulder. The head has to sit at least 5% below it.
- The signal is the first close above the neckline within 40 days of the right shoulder, as long as the price hasn’t closed below the head in between.
Everything in the rules is known on the day of the signal. Then I measured the change 20 and 60 trading days later and compared it with the same measure from every day in the data.
What happened after the breakout
| Market | 20 days later |
60 days later |
|---|---|---|
| S&P 500, 57 breakouts | +1.53%, 61% | +1.78%, 65% |
| S&P 500, any day | +1.07%, 61% | +2.65%, 67% |
| Gold, 21 breakouts | +1.86%, 57% | +1.66%, 57% |
| Gold, any day | +0.75%, 56% | +2.44%, 63% |
| Bitcoin, 12 breakouts | −0.47%, 50% | −2.15%, 50% |
| Bitcoin, any day | +1.48%, 55% | +6.39%, 58% |
Each cell is the median change, then how often the market was higher. The “any day” rows are the same measure from every day in the data.
On the S&P 500 the first month after a breakout was a little better than an average month, but the market rose just as often as on any day, and three months out the breakouts were behind. The target was reached within 60 days in 26 of the 57. In 24 of them the index closed back below the neckline within five days, the classic failed breakout.
Gold looks the same: a slightly better first month, a weaker three months. Bitcoin’s 12 breakouts went up half the time, against a market that rose on 55% to 58% of all days. Two of them, in April and May 2021, came just before the 2021 crash and were down 38% and 44% after 60 days.
Two examples from the same rules
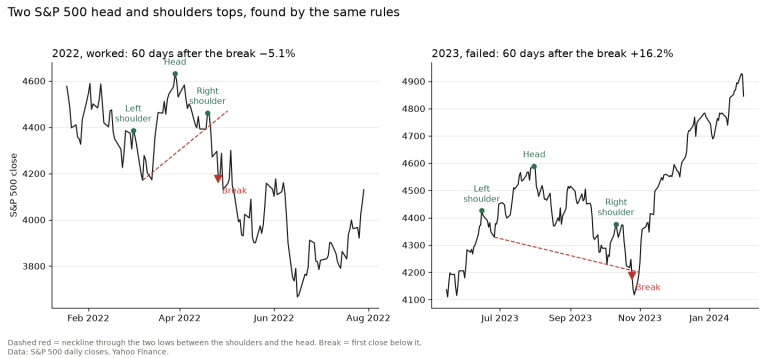
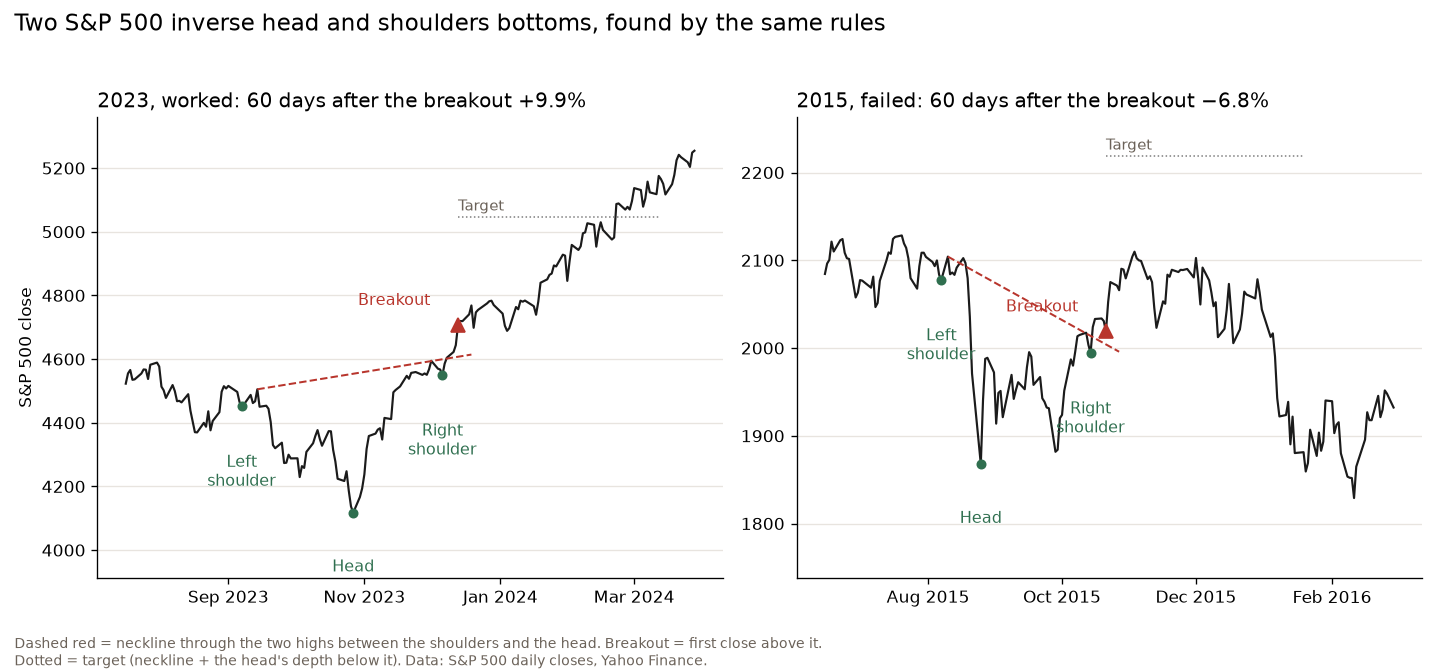
The 2023 one is the chart book version. The left shoulder was 7 September, the head the 27 October low and the right shoulder 6 December, and the index broke the neckline on 13 December. It reached the target and was 9.9% higher 60 days later. The head of that pattern came two days after a head and shoulders top on the same index broke down, which tells you something about how much either signal is worth.
The 2015 one looks just as convincing: a left shoulder in early August, the head on 25 August after the sharp fall that month, a right shoulder on 14 October and a breakout on 21 October. The index never reached the target, and 60 days later it was 6.8% lower, in the sell-off of January 2016.
Does waiting for confirmation help?
A common answer to failed breakouts is to wait a few days and only act if the price stays above the neckline. The breakouts that stayed above it for five days did do better, but you only know that after the five days. Measured from the close on the fifth day, the 33 S&P 500 breakouts that held were higher 20 days later only 48% of the time, with a median of −0.03%, and 60 days later 61% of the time with a median of +1.98%. Waiting didn’t add anything.
I also changed the rules: deeper heads, wider swings, tighter shoulders, a shorter time to break out. In every version the median 20-day change was a bit above the any-day +1.07%, while the share of rises stayed close to the any-day 61%. By 60 days any difference was gone, with medians from +1.0% to +3.9% against +2.65%.
What I take from it
The inverse head and shoulders is a description of what a market did, not a forecast of what it will do. A market that made a low, a lower low and a higher low and then broke above its recent highs is already in a better trend than before, and that much is true. But the data say the pattern adds little or nothing to that. It is easy to see on old charts because you already know which lows were the bottom.
On my own charts a bottom like this is one input, next to the moving averages, volume and the levels around it. I care more about whether the price is back above its 50-day and 200-day averages than about exactly where the neckline goes. Where the pattern does help is the stop: under the right shoulder, the last low the buyers defended. If that low breaks, the bottom wasn’t one.
FAQ
Is an inverse head and shoulders bullish?
It is meant to be. On the S&P 500 since 1970 the breakouts were higher 60 days later in 65% of cases, against 67% for any day, so in this data it was no more bullish than an average day.
How do you calculate the inverse head and shoulders target?
Take the distance from the head up to the neckline and add it to the neckline at the breakout. On the S&P 500 the target was reached within 60 trading days in 26 of 57 cases.
How often does an inverse head and shoulders fail?
On the S&P 500, 24 of the 57 breakouts closed back below the neckline within five days. Measured against any day, the pattern didn’t do better after three months.
Not financial advice. This is educational content, shared for information and entertainment only, and it is not a recommendation to buy or sell any asset. Backtests and past results do not guarantee future results, and the numbers or charts here may contain mistakes. Trading carries risk, including losing all the money you put in. Do your own research before you make any decision.