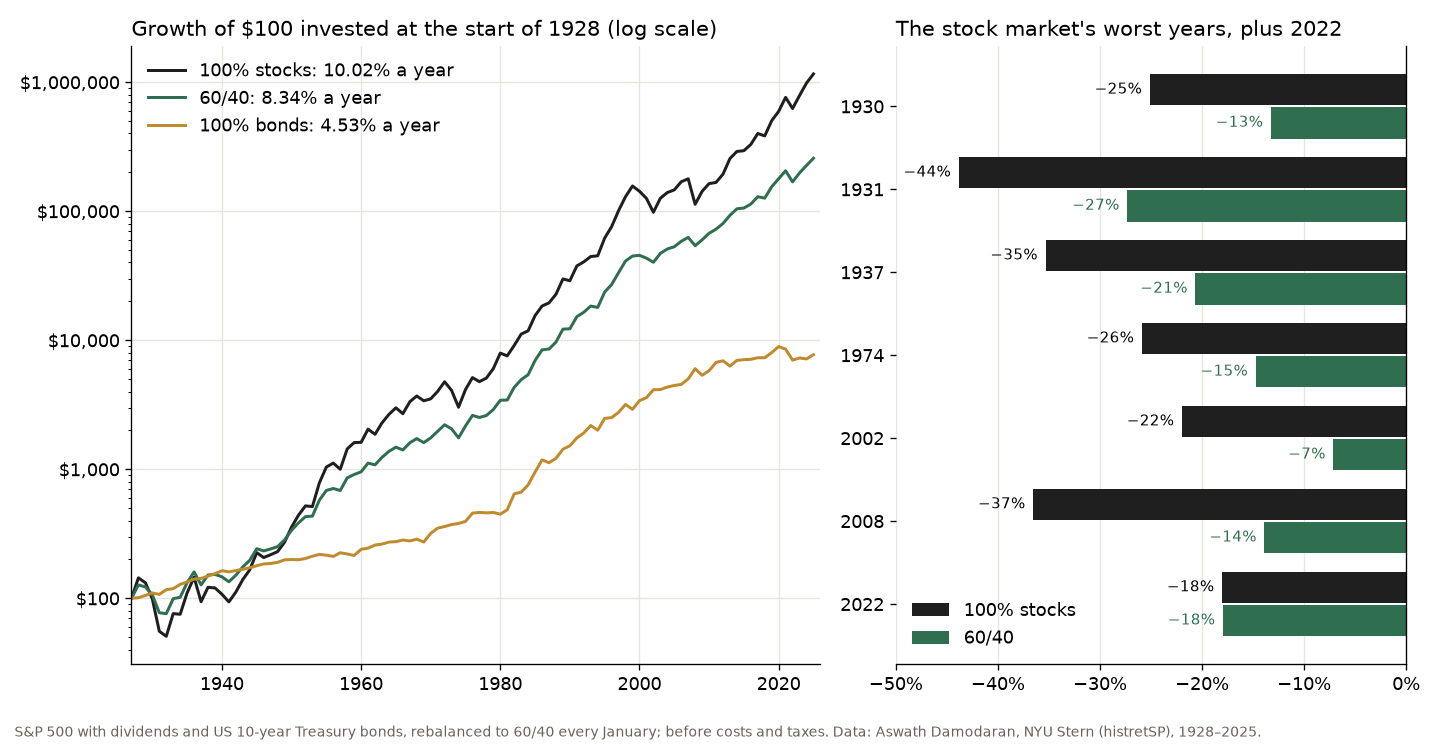
A 60/40 portfolio holds 60% stocks and 40% bonds and is rebalanced back to that mix. With the S&P 500 and 10-year Treasury bonds, rebalanced every January from 1928 to 2025, it made 8.34% a year against 10.02% for stocks alone. Its worst year was −27.3% against −43.8%, and it never lost money over any 10-year stretch. In 2022 stocks and bonds fell together and the 60/40 lost 18.0%, as much as stocks.
What is a 60/40 portfolio?
It’s the plainest mix there is: 60% of the money in stocks, 40% in bonds. Stocks do the growing, bonds are meant to hold up when stocks don’t. Once a year, or when the weights drift far enough, you sell some of whatever did better and buy the other, back to 60/40. That rebalancing is the whole strategy. No forecasts, no timing.
To test it I used Aswath Damodaran’s annual return data from NYU Stern: the S&P 500 with dividends reinvested and the US 10-year Treasury bond, 1928 to 2025. I rebalanced every January and ignored costs and taxes. Real funds are messier, but this is the idea in its cleanest form.
60/40 portfolio returns since 1928
Here is every mix from all stocks to all bonds, 98 years of data:
| Mix | % a year | Worst year, % | Down years |
|---|---|---|---|
| Stocks | 10.02 | −43.8 | 26 |
| 70/30 | 8.83 | −31.5 | 24 |
| 60/40 | 8.34 | −27.3 | 21 |
| 50/50 | 7.81 | −23.2 | 20 |
| Bonds | 4.53 | −17.8 | 20 |
The first 40% of bonds cost about 1.7 points a year: $100 in stocks at the start of 1928 grew to about $1.16 million, in the 60/40 to about $257,000. After inflation the 60/40 made 5.15% a year and stocks 6.78%. In my review of Mebane Faber’s Global Asset Allocation I wrote that the 60/40 returned around 5% a year before inflation. On this data, 5% is what it made after inflation; before inflation it was 8.34%.
What the bonds bought you
Smaller falls, mostly. In 1931 stocks lost 43.8% and the 60/40 27.3%. In 2008 stocks lost 36.5%, but 10-year Treasuries gained 20.1%, so the 60/40 lost 13.9%. From 2000 to 2002 stocks fell three years in a row, 37.4% in total, while bonds made 41.8% and the 60/40 lost only 10.6%. That decade is the best case for the mix: from 2000 to 2009 it made 2.93% a year while stocks lost 0.95% a year.
Over 10 years it never lost money. I checked all 89 ten-year windows from 1928 on. The worst for the 60/40 was +1.80% a year, starting in 1929. Stocks lost money in five of them, the ones starting in 1928, 1929, 1930, 1999 and 2000. If the thing that scares you is a lost decade, the bonds did their job.
2022: the year the 60/40 didn’t work
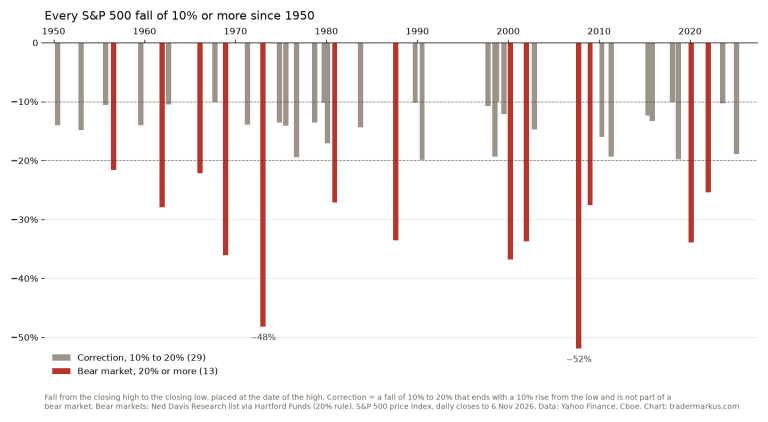
The mix only cushions a fall when bonds go up, or at least don’t fall, while stocks drop. In 2022 the S&P 500 lost 18.0% and 10-year Treasuries lost 17.8%, because the inflation that hit stocks also pushed rates up. The 60/40 lost 18.0%, the same as stocks and its third worst year since 1928. Since 1928 stocks and these bonds fell in the same year only five times, in 1931, 1941, 1969, 2018 and 2022. In 2018 the bond loss was 0.02%, so 2022 was the only time both fell hard.
It also took longer to get back. Measured at year-ends, stocks were back above their end-2021 level by the end of 2023. The 60/40 needed until the end of 2024, because bonds made 3.9% in 2023 and lost 1.6% in 2024 while stocks gained over 24% in both years.
What it cost you
Return, most of the time. The 60/40 beat stocks in only 19 of the 89 ten-year windows, and almost all of those started just before a crash: around 1929, the late 1960s and early 1970s, and 1998 to 2003. From 2010 to 2025 it made 9.53% a year against 14.00% for stocks. That gap is the price of the smoother ride, and in a long bull market it looks expensive.
Is the 60/40 portfolio dead?
Every few years someone says so, and 2022 gave them their best year for it. The data say something less dramatic. How stocks and bonds move together changes from era to era. From 2000 to 2009 their yearly returns had a correlation of −0.86, which is why the mix worked so well. From 2010 to 2025 it was +0.23. Bonds still pay you something, and they still helped in 2000–2002 and 2008, but they’re not a guaranteed hedge. Inflation is what breaks them.
I don’t run a 60/40 myself. I trade, and I use the 200-day moving average to decide how much risk to carry, which is a different answer to the same problem: how to survive the bad years without giving up the good ones. The 60/40 answers it with no decisions at all, and I respect that more than most clever systems. The risk is giving up on it after a year like 2022: in 2023 it made 17.2%.
FAQ
What is the 70/30 Buffett rule?
There isn’t one. In his 2013 letter Warren Buffett wrote that his will tells the trustee of a bequest for his wife to put 90% in a very low-cost S&P 500 index fund and 10% in short-term government bonds. With T-bills as the short-term part, that 90/10 made 9.53% a year from 1928 to 2025, with a worst year of −39.2%. A 70/30 made 8.83%, worst year −31.5%.
What is the expected 10-year return for a 60/40 portfolio?
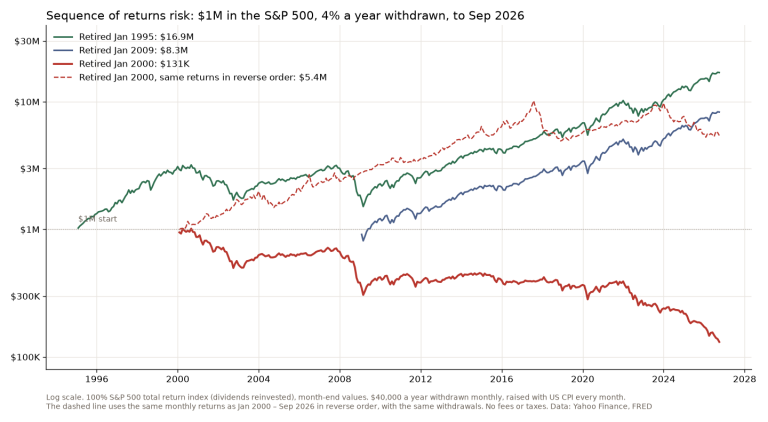
Nobody knows the next ten years. Over the past 89 ten-year windows the 60/40 made between 1.80% and 16.04% a year, with a median of 8.04%. The starting point matters a lot. The weakest decades began right before a crash, which is the same sequence of returns risk that hits people who retire into a bear market.
At what age should you have a 60/40 portfolio?
Age is a rough proxy. The better question is what fall you can sit through without selling. The 60/40 lost 27.3% in its worst year and about 40% from top to bottom in the early 1930s, measured at year-ends. If that would make you sell, the mix is too aggressive for you whatever your age.
Is a 60/40 portfolio too conservative?
For a long horizon and a strong stomach, it gave up about 1.7 points a year against stocks since 1928. That’s a lot over decades. Its value is in the bad years, and you only find out which kind of investor you are when one arrives.
The 60/40 is boring on purpose. It paid about 1.7 points a year to cut the worst year from −44% to −27%. Whether that’s a good deal depends less on the numbers than on what you’d do in the next 2022.
Not financial advice. This is educational content, shared for information and entertainment only, and it is not a recommendation to buy or sell any asset. Backtests and past results do not guarantee future results, and the numbers or charts here may contain mistakes. Trading carries risk, including losing all the money you put in. Do your own research before you make any decision.