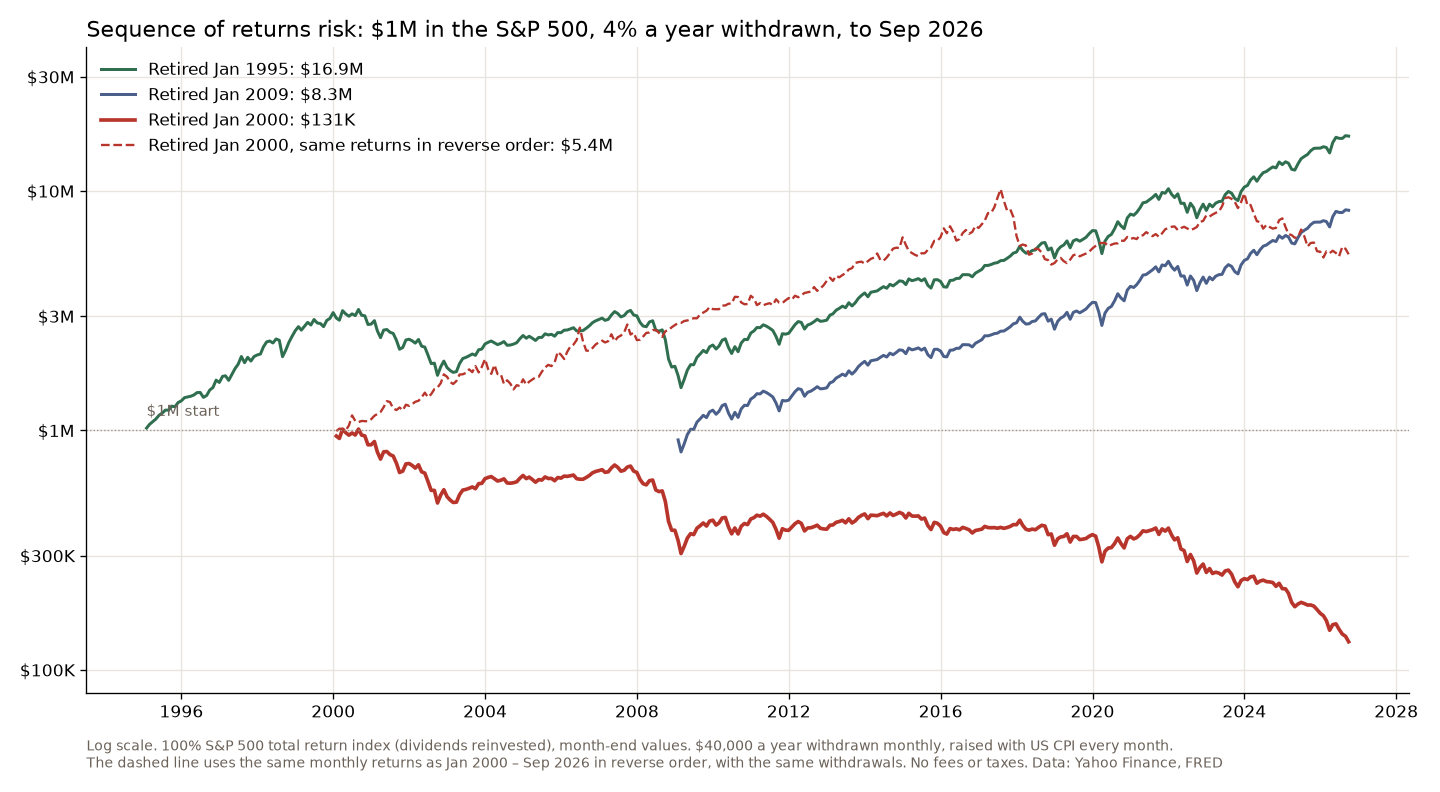
Sequence of returns risk is the danger that bad years come at the start of retirement, while you are taking money out. I ran it on real S&P 500 data: $1 million, 4% withdrawn in the first year and raised with inflation after that. Someone who retired in January 1995 has $16.9 million today. Someone who retired in January 2000 has $131,002 left. Same index, five years apart. Run the 2000 retiree’s returns in reverse order and they would have $5.4 million.
What is sequence of returns risk?
While you are saving, the order of good and bad years doesn’t matter much. Ten years at +10% and −10% end in the same place whichever comes first, as long as nothing goes in or out. Once you start taking money out, the order matters a lot. A fall in the first years forces you to sell more shares to pay the same bills, and those shares are gone when the market recovers. A fall in year 20 hurts much less, because by then the portfolio has grown, or most of the withdrawals are already behind you.
Every explainer I found uses made-up numbers for this. I wanted to see it on the actual market.
How I tested it
I used the S&P 500 total return index from Yahoo Finance, which includes dividends, at month-ends up to September 2026, and the US consumer price index from FRED for inflation. The retiree starts with $1,000,000 and withdraws $40,000 a year, paid monthly at the start of each month. The withdrawal rises with CPI every month, so it buys the same amount every year. The money is 100% in the S&P 500. No fees and no taxes.
That 100% is important. It is not how the 4% rule was built, and I come back to it below. It makes the effect bigger and easier to see.
Sequence of returns risk example: 1995 vs 2000
| Retired in | Value now |
|---|---|
| January 1990 | $21,973,540 |
| January 1995 | $16,945,648 |
| January 2000 | $131,002 |
| January 2007 | $3,522,167 |
| January 2009 | $8,304,864 |
The 1995 retiree had five great years first. By the end of 1999 their $1 million had become $3.1 million, after withdrawals. When the 2000–2002 crash came it took a big bite, but from a much larger base, and the withdrawals were a small share of the portfolio.
The 2000 retiree got the crash first. In the first ten years the S&P 500 with dividends lost 0.95% a year. By the end of 2002 their portfolio was down to $528,557, and in February 2009 it was $305,940. They kept withdrawing the whole time, and the withdrawal kept rising with prices: it is $79,456 a year now. The market recovered strongly after 2009, but the portfolio never did, because each year’s withdrawal was a bigger and bigger share of what was left. At today’s withdrawal, $131,002 lasts less than two years even if the market goes nowhere.
Over the whole period the 2000 retiree’s index still made 8.32% a year. That is a perfectly good return. The problem was when it came. As I wrote in my review of Gregory Morris’s Investing with the Trend, for buy-and-hold investors the results depend on the time one was born.
Same returns, different order
To show that the order alone does this, I took the 321 monthly returns from January 2000 to September 2026 and ran them backwards: the strong 2010s first, the 2000s at the end. Same returns, same average, same withdrawals.
In the real order the 2000 retiree ends with $131,002. In reverse order they end with $5,436,918. Nothing about the market changed except the sequence. That’s the whole risk in one number.
Does the 4% rule still work?
The 4% rule comes from William Bengen’s 1994 article in the Journal of Financial Planning. He tested a portfolio of 50% US large-cap stocks and 50% intermediate-term Treasuries on 1926–1992 data, with the first year’s withdrawal raised for inflation every year, and found that 4% was the highest starting rate that lasted at least 30 years in every period he tested. My test is 100% stocks and a 26-year retirement that isn’t over yet, so it doesn’t prove or disprove his rule. Bonds would likely have helped the 2000 retiree: Treasury yields fell in both 2000–2002 and 2008, so Treasuries gained while stocks fell.
What it does show is the shape of the risk. The 4% rule was set by the worst starting years in Bengen’s data. In my test, January 2000 was by far the worst of the seven start dates I ran. If you retire into a crash, you live on the bad side of the average.
How to reduce sequence of returns risk
There is no trick that removes it, but the usual defences all attack the first few years:
- Hold some bonds or cash around the retirement date. Two or three years of spending outside stocks means you don’t have to sell shares at the bottom.
- Be flexible with withdrawals. Skipping the inflation raise after a down year, or cutting spending by 10% for a while, matters most in the first five years.
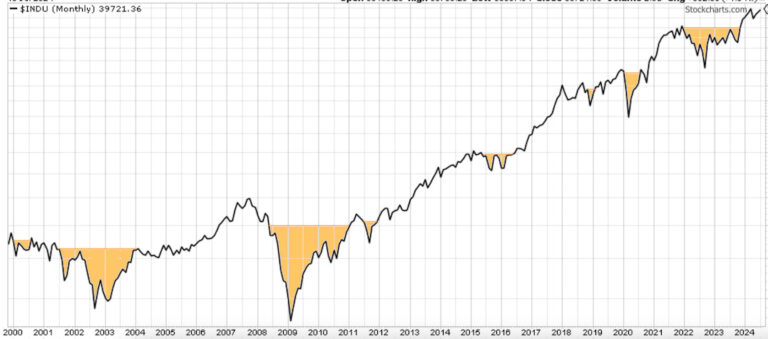
- Know your drawdown before it happens. The S&P 500 with dividends fell 47% and then 55% in the 2000s. If a fall like that would force you to sell, your plan has too much in stocks for that stage of life.
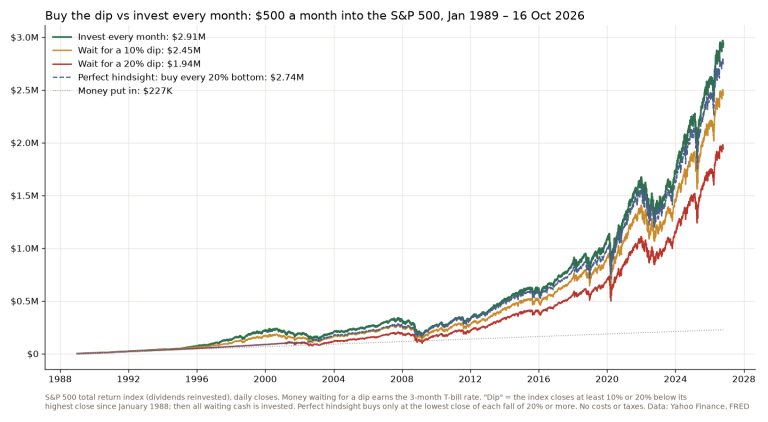
Waiting for a better moment to invest is not one of them. My test of buying the dip found that holding cash back until the market was 10% or 20% below its high lost to investing every month in all 215 overlapping 20-year periods that started from 1989 to 2006. The risk is in what you take out, not in when you put money in. I have written about how much of trading is surviving the bad stretches in Drawdowns are like scars, and the 200-day moving average post shows one way to cut the depth of a fall, at a price.
FAQ
What is an example of sequence of returns risk?
Two retirees with $1 million in the S&P 500 and the same 4% withdrawals: one who started in January 1995 has $16.9 million today, one who started in January 2000 has $131,002. The 2000 retiree met the dot-com crash and 2008 in the first decade.
How do you beat sequence of returns risk?
You can’t remove it, but you can reduce it: keep a few years of spending in bonds or cash when you retire, and be ready to cut withdrawals after bad years, especially early on.
What is the 4% rule?
Withdraw 4% of your portfolio in the first year of retirement and raise that dollar amount with inflation every year. William Bengen found in 1994 that a 50/50 portfolio of US stocks and intermediate-term Treasuries lasted at least 30 years at that rate in every historical period he tested, using 1926–1992 data.
The market’s average return is a fact about the market. Your return as a retiree is a fact about your dates.
Not financial advice. This is educational content, shared for information and entertainment only, and it is not a recommendation to buy or sell any asset. Backtests and past results do not guarantee future results, and the numbers or charts here may contain mistakes. Trading carries risk, including losing all the money you put in. Do your own research before you make any decision.