The S&P 500’s average return since 1928 is about 10% a year with dividends reinvested: 10.0% compounded over 98 calendar years, 1928–2025. Without dividends it is 6.3% a year, and after inflation 6.8%. The catch is that the “average year” almost never happens. Only 4 of those 98 years ended between 8% and 12%; 36 gained more than 20%, and 26 were down.
What is the average return of the S&P 500?
It depends on three choices people rarely mention: which years, whether dividends are included, and whether inflation is taken out. I used the annual S&P 500 returns with dividends that Aswath Damodaran publishes at NYU Stern (1928–2025), checked them against the S&P 500 Total Return index on Yahoo Finance for 1989–2025 (the years differ by 0.18 percentage points on average, at most 0.52), took the price-only returns from the index itself and inflation from the US CPI on FRED. Before March 1957 the index had 90 stocks, not 500, so the early years are its predecessor.
| Years | Total | Price | Real |
|---|---|---|---|
| 1928–2025 | 10.0% | 6.3% | 6.8% |
| 1950–2025 | 11.6% | 8.2% | 7.8% |
| 1976–2025 | 11.9% | 9.0% | 8.0% |
| 1996–2025 | 10.3% | 8.4% | 7.6% |
| 2006–2025 | 10.9% | 8.9% | 8.2% |
| 2016–2025 | 14.7% | 12.9% | 11.1% |
All figures are compound annual returns over full calendar years, before costs and taxes. Total is the return with dividends reinvested, Price leaves the dividends out, and Real is the total return after US inflation. Dividends are worth almost 4 percentage points a year over the full period. That is the difference between $1 growing to about $388 since 1928 and growing to about $11,576.
Why you see two different averages
Add up the 98 yearly returns and divide by 98 and you get 11.9%. Compound them, which is what actually happens to money, and you get 10.0%. Both are “the average return”, and articles mix them freely. The gap comes from volatility. A year of +50% followed by a year of −50% averages 0%, but $100 becomes $150 and then $75. The bigger the swings, the further the simple average sits above what you really earned. For anything to do with your own money, the compound figure is the one that counts.
The average year almost never happens
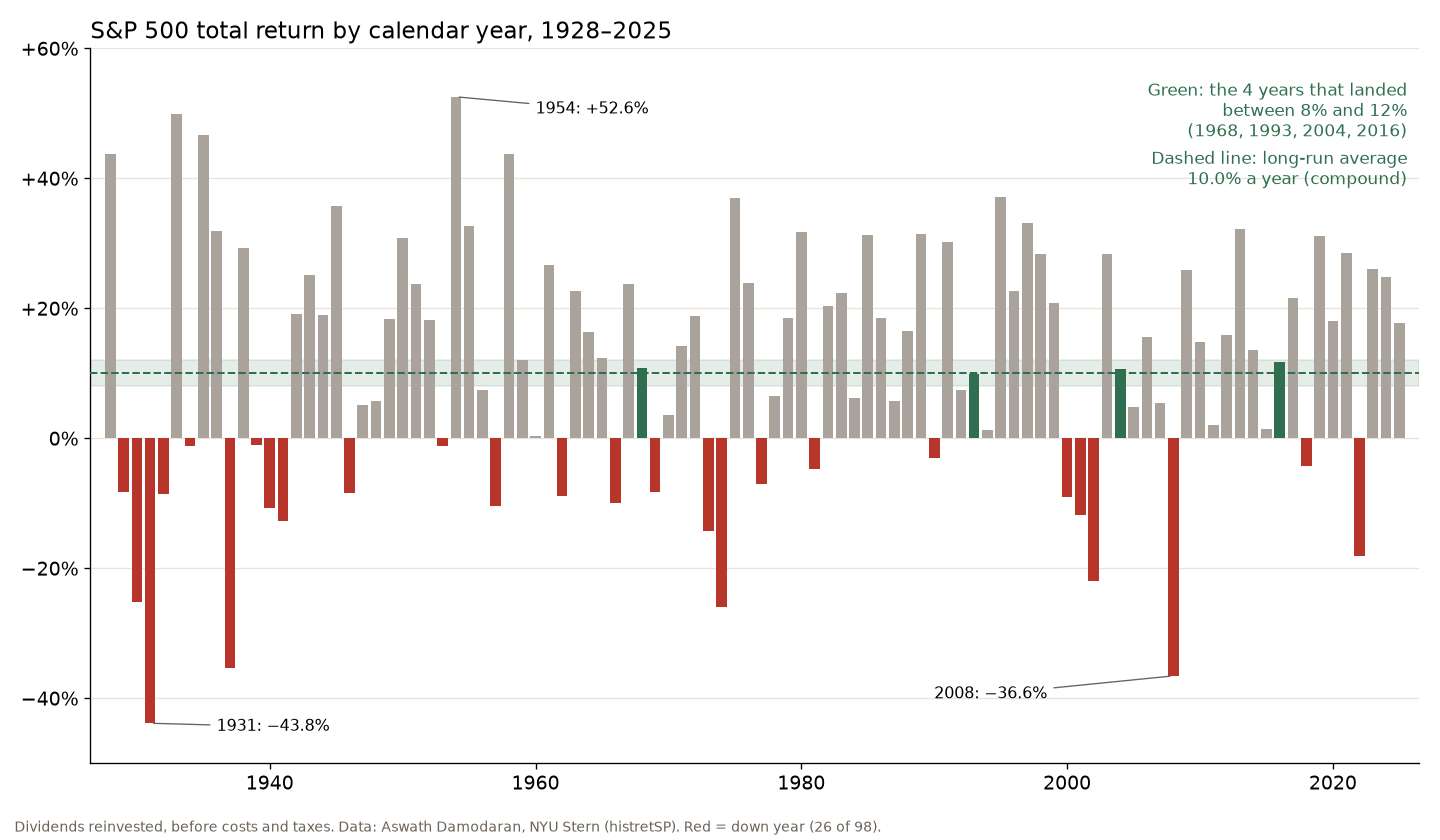
This is the part I’d want a new investor to see before the 10% figure. In 98 years the market finished between 8% and 12% only four times: 1968, 1993, 2004 and 2016. Thirty-six years gained more than 20%. Twenty-six years lost money, twelve of them more than 10%. The best year was 1954 at +52.6%, the worst 1931 at −43.8%, and in living memory 2008 took 36.6% off. The standard deviation of the yearly returns is about 19%, almost twice the 10% average. The 10% is real, but it is what is left after a lot of very different years are averaged together. Nobody gets it as a smooth line.
S&P 500 average return over the last 10 and 20 years
The last ten years were unusually good. From 19 October 2016 to 19 October 2026 the S&P 500 Total Return index rose 4.2 times: $1,000 became about $4,230, or 15.5% a year. Over 20 years, from 19 October 2006, it was 11.1% a year, so $1,000 became about $8,224. Without dividends the same periods give 13.6% and 9.0%. This year so far, the index is up 13.4% with dividends.
I wouldn’t plan on another 15% decade. The ten best ten-year stretches in the data overlap a lot, but nine of the ten were followed by a weaker decade. The 1990s returned 18.1% a year; the next ten years, 2000–2009, lost 1.0% a year. That isn’t a law, but it is a good reason not to extrapolate the last ten years.
How bad can a 10-year stretch be?
I ran every rolling window of full calendar years. Out of 89 ten-year windows, five lost money: three starting in 1928–1930, through the Great Depression, and two in 1999–2008 and 2000–2009, the lost decade with the dot-com crash and 2008 back to back. The worst was 1929–1938 at −1.7% a year. Over 20 years no window lost money; the worst was 1929–1948 at 2.4% a year, and the median was 10.9%. Over 30 years the worst was 8.0% a year. Time does narrow the range, but it takes longer than most people expect, and a 10-year horizon is not long enough to be sure of anything.
| Window | Worst | Median | Best |
|---|---|---|---|
| 1 year | −43.8% | 15.2% | 52.6% |
| 5 years | −12.7% | 12.6% | 28.3% |
| 10 years | −1.7% | 11.0% | 20.1% |
| 20 years | 2.4% | 10.9% | 17.7% |
| 30 years | 8.0% | 10.8% | 13.6% |
Annual compound returns with dividends, rolling windows of calendar years 1928–2025. The 1-year median above 10% is the same volatility effect as before: typical years are good, and the bad ones are very bad.
Does the S&P 500 double every 5 years?
No, not usually. Doubling in five years needs about 14.9% a year. With dividends reinvested, 30 of the 94 five-year windows since 1928 managed it, roughly one in three, and the recent run is why the idea is popular now: six of the eleven five-year windows starting from 2009 to 2019 doubled. At the long-run 10% the rule of 72 says money doubles about every 7.2 years, and at the 6.8% after inflation closer to every 10.6 years.
What I take from the numbers
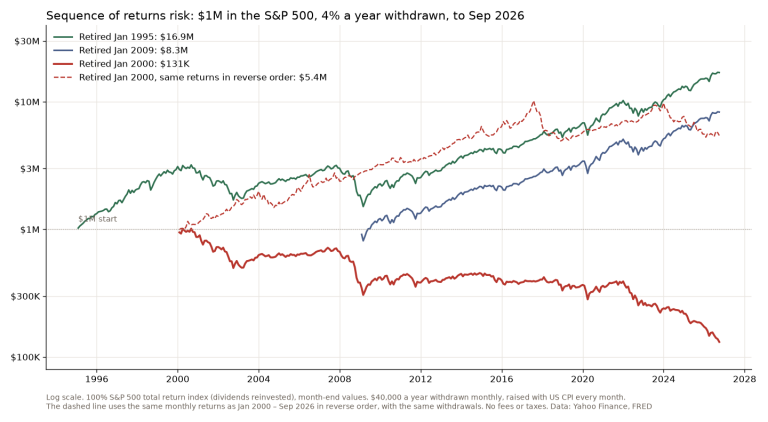
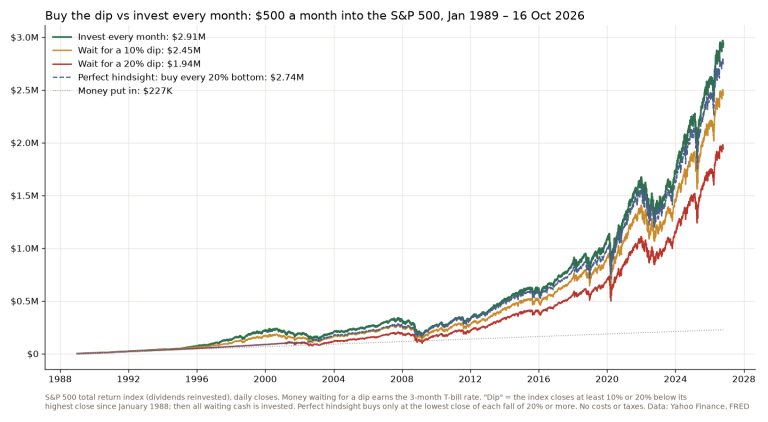
For planning I use something like the after-inflation figure, 6–7% a year, not the 10% headline and certainly not the last decade’s 15%. It is the honest number for what your savings can buy later. The second lesson is about patience. The long-run return belongs to whoever is still holding after the bad years, and the data say the bad years come in clusters: 1929–1932, 1973–1974, 2000–2002, 2008. When I reviewed Burton Malkiel’s A Random Walk Down Wall Street I put it more bluntly: “Average annual return of 10% for the risk of 50% drawdowns? No, thank you!” As a trend follower I try to step aside in some of them; my 200-day moving average test shows what that cost and saved. Calendar tricks are small by comparison: skipping September every year added about one percentage point a year in my worst-month study, before costs and the dividends you’d miss. Falls like these are the price of the long-run number, and they feel worse when you live through them than they look in a table, which is the point of my post on why every strategy has drawdowns. For someone already withdrawing money, the order of those years matters as much as the average, as my sequence of returns study shows. And waiting on the side for a better entry has cost more than it saved: see what buying the dip did since 1989.
FAQ
What is the S&P 500 average return over the last 20 years?
About 11% a year with dividends reinvested: 10.9% for the calendar years 2006–2025, and 11.1% from 19 October 2006 to 19 October 2026. Without dividends, about 9%. After inflation, 8.2% for 2006–2025.
What is the average 10-year annualized return of the S&P 500?
The median of all 89 ten-year windows since 1928 is 11.0% a year with dividends. The range is wide: from −1.7% a year (1929–1938) to 20.1% (1949–1958). The most recent full decade, 2016–2025, returned 14.7% a year.
What if I invested $1,000 in the S&P 500 10 years ago?
With dividends reinvested, $1,000 put in on 19 October 2016 was worth about $4,230 on 19 October 2026, before fees and taxes. Without the dividends, about $3,587. A real index fund would be a little lower because of its fees.
So the S&P 500 does return about 10% a year, if you hold it for decades, reinvest every dividend, ignore inflation and sit through years like 1931 and 2008. Take away the conditions one at a time and the number gets smaller. That’s worth knowing before the next bad year, not during it.
Not financial advice. This is educational content, shared for information and entertainment only, and it is not a recommendation to buy or sell any asset. Backtests and past results do not guarantee future results, and the numbers or charts here may contain mistakes. Trading carries risk, including losing all the money you put in. Do your own research before you make any decision.