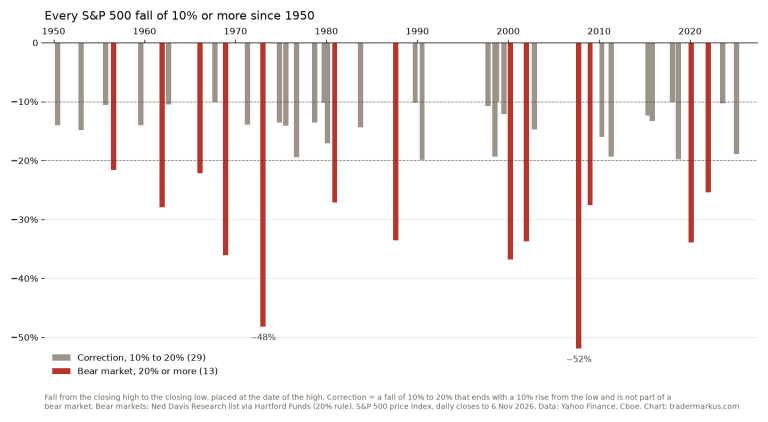
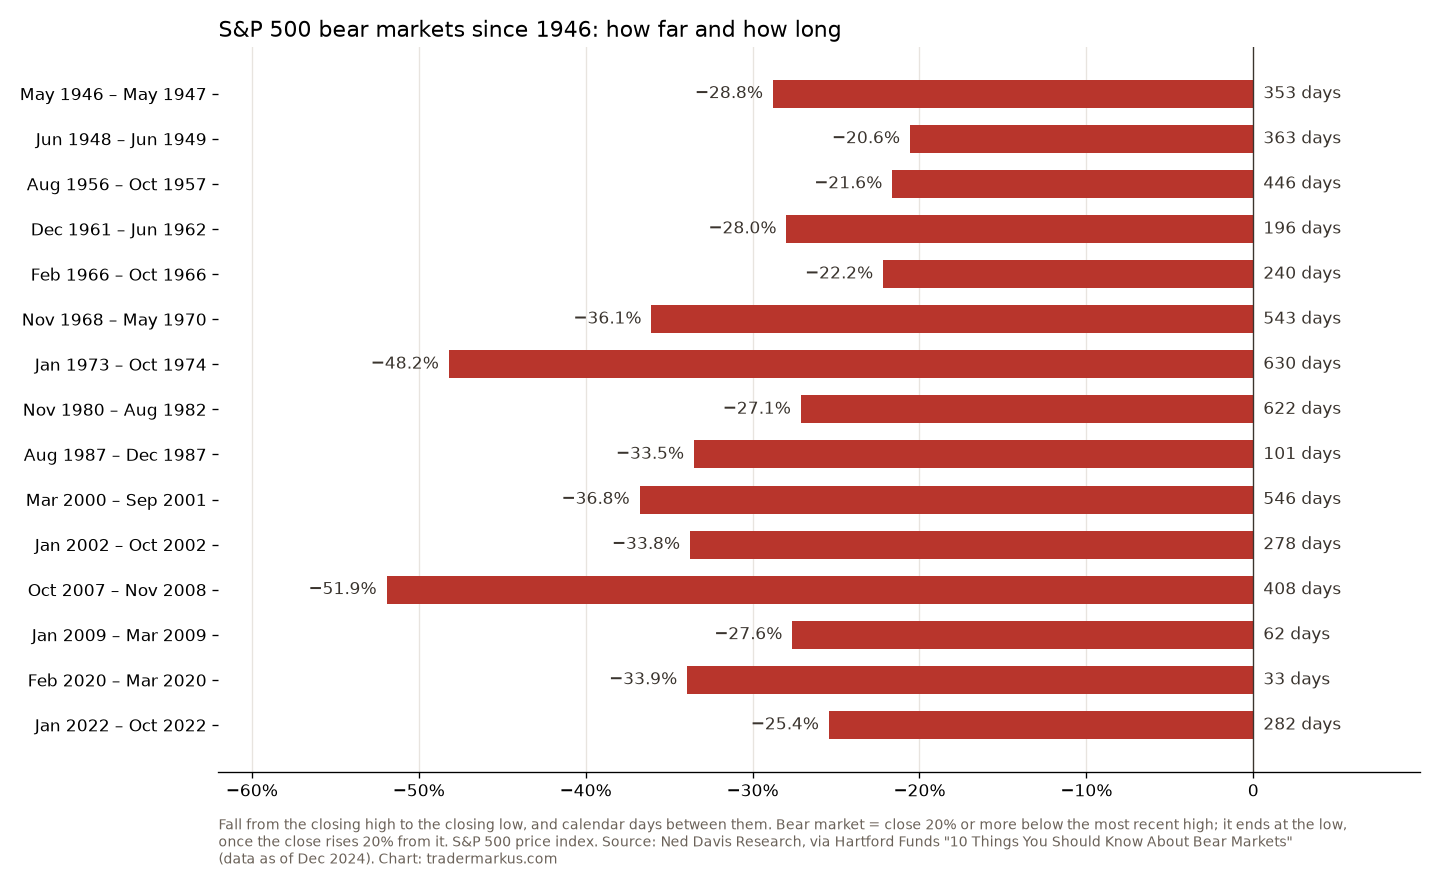
The S&P 500 has had 27 bear markets since 1928. The average one lasted 289 days, about nine and a half months, and took the index down 35%. The longest ran 630 days, from January 1973 to October 1974. The shortest, in 2020, was over in 33. And five times since 1990 the index fell more than 18% and stopped just short of the 20% line, most recently in April 2025.
Those headline numbers come from Ned Davis Research, published by Hartford Funds, the list most articles quote. I rebuilt it from daily S&P 500 closes to see how the rule works, and added the part most lists leave out: how long it took to get back to where the fall started.
What counts as a bear market?
The usual rule, and the one Ned Davis uses: a bear market starts when the S&P 500 closes 20% or more below its most recent high, and it ends at the lowest close, once the index has risen 20% from that low. A drop of 10% to 19.9% is a correction. Both are measured on closing prices, without dividends.
When I ran that rule myself on daily closes, I got the same 27 bear markets, and from 1948 on the same start and end dates, with one exception. In 2002 the index rose 20.7% from its July low by late August, which by the strict rule ends that bear in July. Ned Davis carries it on to the October 2002 low. Lists can differ on details like that, so treat any count as a count under a rule.
How long do bear markets last?
Across all 27, the average was 289 days from the high to the low and the median 250. The 15 since World War II lasted longer on average, 340 days, but fell less, 31.7% on average. The ones before 1946 came often: 12 in the 18 years from 1928 to 1945. Since then there has been one about every five years.
| Start | Fall | Days | Back above |
|---|---|---|---|
| May 1946 | −28.8% | 353 | 1950 |
| Jun 1948 | −20.6% | 363 | 1950 |
| Aug 1956 | −21.6% | 446 | 1958 |
| Dec 1961 | −28.0% | 196 | 1963 |
| Feb 1966 | −22.2% | 240 | 1967 |
| Nov 1968 | −36.1% | 543 | 1972 |
| Jan 1973 | −48.2% | 630 | 1980 |
| Nov 1980 | −27.1% | 622 | 1982 |
| Aug 1987 | −33.5% | 101 | 1989 |
| Mar 2000 | −36.8% | 546 | 2007 |
| Jan 2002 | −33.8% | 278 | 2004 |
| Oct 2007 | −51.9% | 408 | 2013 |
| Jan 2009 | −27.6% | 62 | 2009 |
| Feb 2020 | −33.9% | 33 | 2020 |
| Jan 2022 | −25.4% | 282 | 2024 |
Bear markets in the S&P 500 since 1946: fall and calendar days from the closing high to the closing low (Ned Davis Research), and in “Back above”, the year the index first closed back above the high where the bear started (my calculation from daily closes).
The falls are short; the way back can be long
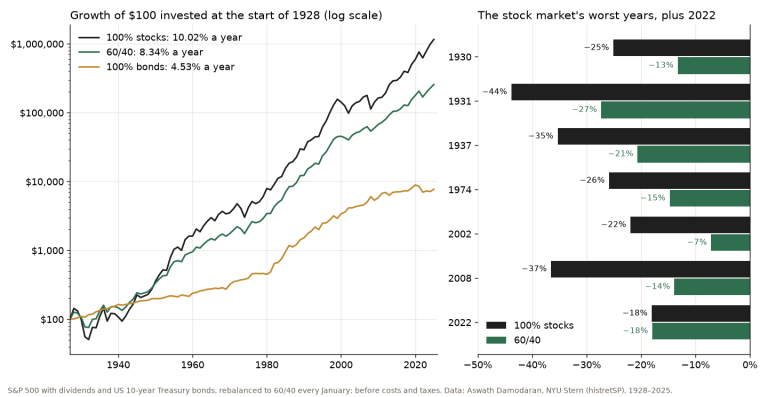
The length of the fall is only half of it. After the 2020 crash the index was back above its February high on 18 August 2020, five months after the low. After 2022 it took until 19 January 2024. After the 2007 to 2008 bear it took until 28 March 2013, more than four years after the November 2008 low. The 2000 peak was not passed until 30 May 2007, and the January 1973 high not until 17 July 1980.
The extreme case is 1929. Ned Davis splits 1929 to 1932 into several bear markets, but measured from the September 1929 peak to the June 1932 low, the index lost 86.2%, and it didn’t close above its 1929 high again until 22 September 1954.
The ones that almost counted
The 20% line is a convention, and the market doesn’t know about it. Five times since 1990 the S&P 500 fell more than 18% from its high and then turned before reaching 20%:
- 1990: −19.92%, 16 July to 11 October
- 1998: −19.34%, 17 July to 31 August
- 2011: −19.39%, 29 April to 3 October
- 2018: −19.78%, 20 September to 24 December
- 2025: −18.90%, 19 February to 8 April
For anyone holding through them, those felt like bear markets. On paper, they’re not in the count, and the 1990 and 1998 ones are why the bull market from December 1987 to March 2000 is officially one long run.
Where the market is now
Not in one. The worst fall so far in 2026 was 9.1%, from 27 January to 30 March, which isn’t even a correction. On 18 November the S&P 500 closed at 7,323.63, 6.33% below its record close of 7,818.93 on 6 October.
What I take from it
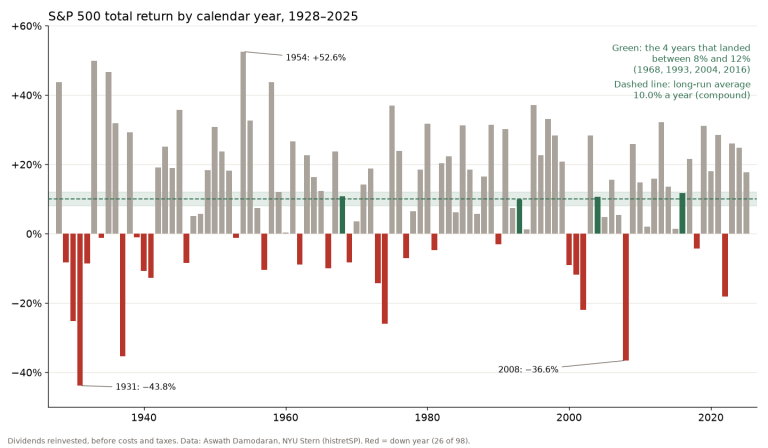
A bear market every five years or so is normal, and it is the price of owning stocks at all. The average numbers are reassuring, about nine months and a third off, but the average isn’t the problem. The problem is the 1973 or 2007 kind, where the fall takes a year or two and getting back takes five or more.
For a trader that means two things. First, size positions so that a 35% fall in the index doesn’t end the account: the risk of ruin math is unforgiving once you’re down that much. Second, have a rule for when you’re wrong, whether that is a stop loss or a trend filter like the 200-day moving average, because nobody knows in month two which kind of bear market they’re in.
FAQ
What was the longest bear market in history?
By the Ned Davis count, January 1973 to October 1974: 630 days and a 48.2% fall. Measured from the 1929 peak to the 1932 low, the Depression decline lasted longer, 32 months, but Ned Davis counts it as several bear markets.
How long did it take the stock market to recover after the 2008 crash?
The S&P 500 first closed above its October 2007 high on 28 March 2013, about four years after the March 2009 low and five and a half years after the peak. With dividends reinvested it was back on 2 April 2012, about a year earlier.
When was the last bear market?
From 3 January to 12 October 2022, when the S&P 500 fell 25.4% over 282 days. It closed above its January 2022 high again on 19 January 2024. In 2025 it came close, falling 18.9% between February and April.
Not financial advice. This is educational content, shared for information and entertainment only, and it is not a recommendation to buy or sell any asset. Backtests and past results do not guarantee future results, and the numbers or charts here may contain mistakes. Trading carries risk, including losing all the money you put in. Do your own research before you make any decision.