A stock market correction is a fall of 10% or more that stops before 20%. Since 1950 the S&P 500 has had 29 of them, about one every 2.6 years. The median correction took the index 13.9% lower over 87 days and needed another 94 days to get back to where it started. Another 13 falls of 10% kept going and became bear markets, so about 31% of them turned into something worse. The Nasdaq-100 is in one right now: on 6 November 2026 it closed 13.6% below its 6 October record.
What is a stock market correction?
The usual definition is a fall of at least 10% from a recent high. At 20% it gets called a bear market instead. Both are measured on closing prices, and nobody rings a bell at either line.
To count them I need a rule for where a fall starts and ends, so here is mine. While the market is rising I track its highest close. A close 10% or more below that high starts a fall. The fall ends when the index closes 10% above its lowest point. Then I measure how deep it went and how many calendar days it took. For bear markets I use the Ned Davis Research list, the same 20% definition most sources quote, so a 10% fall that later reached 20% counts there, not as a correction.
Why not just count falls from record highs? Because that misses every fall that starts below an old record. In 2011 the S&P 500 fell 19.4% between April and October, but it was still below its 2007 record at the time, so a records-only count doesn’t see it at all.
How often does the stock market have a correction?
From January 1950 to 6 November 2026 the S&P 500 had 57 falls of 10% or more by my rule, one every 1.3 years. Some of those were legs inside bear markets, such as the sharp drops in October 1987. Take the bear markets out and 29 corrections are left: one every 2.6 years on average.
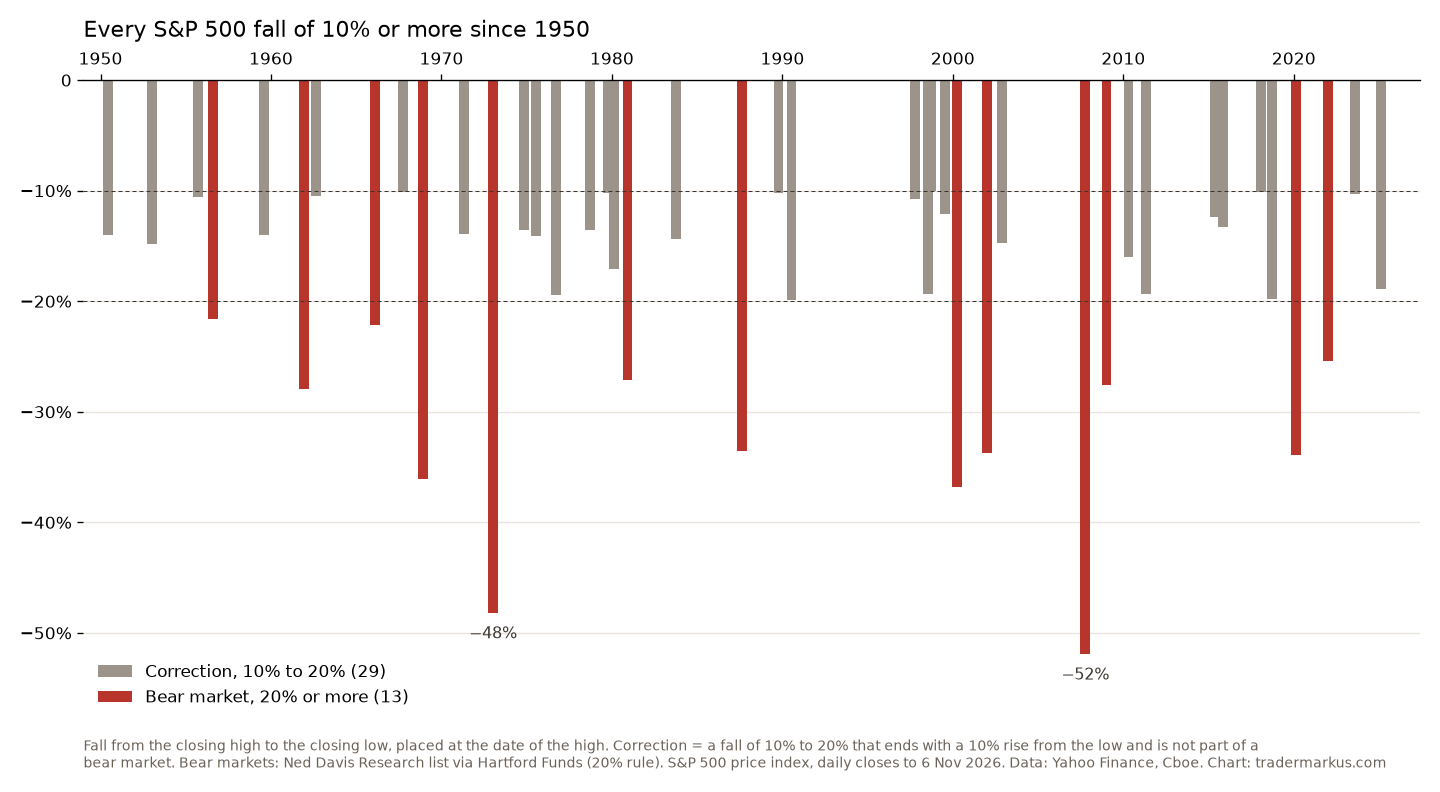
They don’t come at regular intervals. There were three in 1998–99, and none between March 2003 and April 2010, although a bear market came in between. A correction every 2.6 years is a long-run average, not a schedule.
Six corrections came very close to the 20% line and stopped: 1976–78 (−19.4%), 1990 (−19.9%), 1998 (−19.3%), 2011 (−19.4%), 2018 (−19.8%) and 2025 (−18.9%).
| S&P 500 since 1950 |
Corrections | Bear markets |
|---|---|---|
| Number | 29 | 13 |
| Median fall | −13.9% | −33.5% |
| Median days down |
87 | 282 |
How long do corrections last?
The median correction took 87 calendar days from the high to the low, about three months. Getting back to the starting level took a median 94 more days. So a typical correction is over, top to recovery, in about six months.
The range is wide. The shortest fall took 13 days: from 26 January to 8 February 2018 the S&P 500 dropped 10.2%, and it then needed 197 days to get back. The longest took 531 days, from September 1976 to March 1978, for a 19.4% loss, and another 527 days to recover in August 1979.
The most recent one was last year. From 19 February to 8 April 2025 the S&P 500 fell 18.9% in 48 days, and it closed back at the February level on 27 June 2025.
How many corrections turn into bear markets?
Count each bear market once and the S&P 500 had 42 separate falls of 10% or more since 1950. 13 of them went on to 20% or more. That is 31%. The other 69% stopped somewhere between 10% and 20% and recovered.
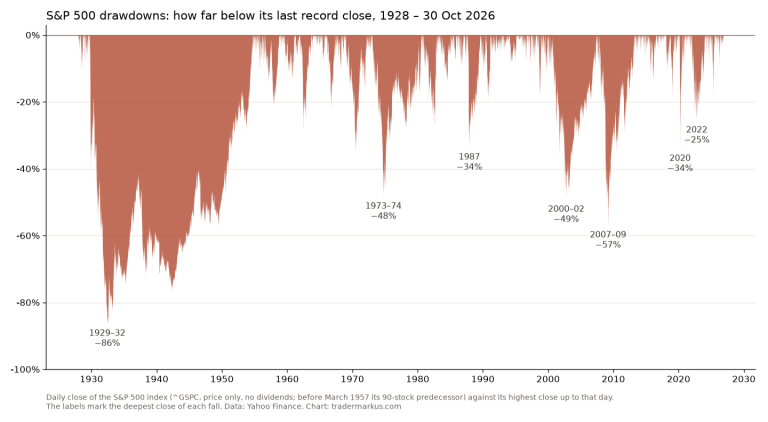
The trouble is that at −10% the two look the same. The 2020 crash and the February 2018 correction both started with a fast drop of about 10% in a couple of weeks. One ended at −34%, the other at −10.2%. If you want to see how the deeper falls played out, my max drawdown study has every S&P 500 fall of 20% or more since 1950 and how long each took to recover. It measures from record highs, so it counts 2000–02 and 2007–09 as one fall each and lists 11, not 13.
The Nasdaq-100 corrects twice as often
I ran the same rule on the Nasdaq-100 from October 1985 to 6 November 2026. It had 48 corrections in those 41 years, one every 10 months or so, against one every 2.6 years for the S&P 500. They were also faster: a median fall of 12.9% in about a month, and less than two months to get back. About a quarter of its 10% falls went on to 20% or more.
The last year shows the pattern. The Nasdaq-100 fell 12.1% from 29 October 2025 to 30 March 2026, then 11.3% from 2 June to 29 July 2026. The third one started at the record close of 31,224.69 on 6 October 2026. It closed 10.4% lower on 2 November, bounced for two days, and then it fell 6.4% on 5 November, its worst day since March 2020. That day it closed at 26,629.81, 14.7% lower. On 6 November it closed at 26,989.99, still 13.6% below the record. By my rule this fall ends only when the index closes 10% above its low, and it hasn’t done that yet.
The S&P 500 is calmer, but not by much any more. On 5 November it fell 4.4%, its worst day since April 2025, and closed at 7,353.73. On 6 November it closed at 7,376.86, 5.7% below its own 6 October record of 7,818.93. The news blamed a sell-off in AI and chip stocks. I make my decisions from the chart, not the news, but the size of the day is worth knowing: since 1975 the S&P 500 has had only 54 days of 4% or worse. One such day says nothing yet about whether this fall stops at 6% or goes on to 20%.
2026 so far
The S&P 500 hasn’t had a correction this year. Its worst fall was 9.1%, from 6,978.60 on 27 January to 6,343.72 on 30 March. Close, but by the 10% rule it doesn’t count. The last S&P 500 correction is still the one in spring 2025.
What I do in a correction
I don’t try to predict them. The numbers above say a correction comes every couple of years, and nothing in them says which month. What I can control is how much a 10% or 15% fall costs me. The chart sets the stop, the position size follows from the distance to it, and the risk on each trade stays small enough that a bad run doesn’t end the account. I wrote about that in how I use stop losses and in the risk of ruin post.
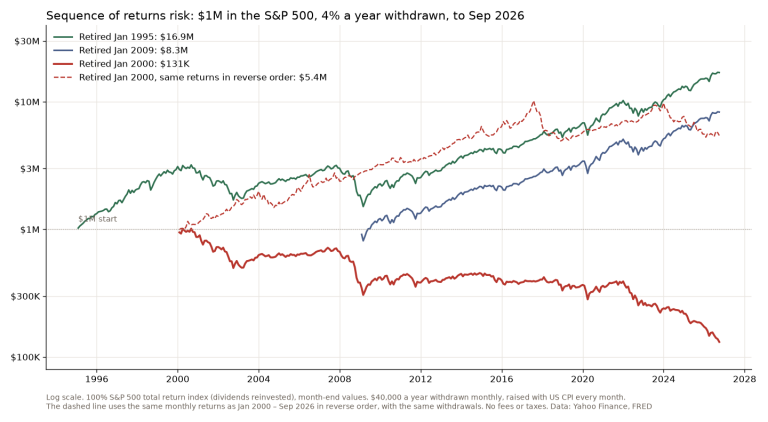
For long-term money my own tests point against the instinct to sit in cash and wait. When I tested waiting for a dip on the S&P 500, keeping cash aside for a 10% fall ended with less than simply investing every month. The exception is someone who is already taking money out: a correction early in retirement does real damage, which is the sequence of returns risk I tested separately.
FAQ
Is a stock market correction coming?
Nobody knows, and I don’t trust anyone who says they do. The base rate is about one every 2.6 years for the S&P 500 and one every 10 months for the Nasdaq-100, which is in one now. That tells you to expect them, not when.
How often is there a 20% correction in the stock market?
A fall of 20% or more is called a bear market. The S&P 500 has had 13 since 1950 by the Ned Davis Research count, about one every six years, with a median fall of 33.5%.
What is the difference between a correction and a crash?
A correction is defined by depth: 10% to 20%. A crash has no official definition and is about speed, a big fall in days or weeks, like October 1987 or March 2020. Both of those went past 20%, so they count as bear markets.
Will I lose my 401k if the stock market crashes?
A fall only becomes a permanent loss if you sell, or have to sell, before the market comes back. Every one of the 29 S&P 500 corrections since 1950 got back to the level it fell from, the slowest in 527 days. Bear markets took longer, sometimes years. How much a 401(k) moves depends on what it holds.
Not financial advice. This is educational content, shared for information and entertainment only, and it is not a recommendation to buy or sell any asset. Backtests and past results do not guarantee future results, and the numbers or charts here may contain mistakes. Trading carries risk, including losing all the money you put in. Do your own research before you make any decision.