Does the wheel strategy work? I modelled it on the S&P 500 for every monthly option expiry from July 2007 to October 2026, checked against Cboe’s real put-selling and covered-call indexes. Run mechanically, the wheel made about 6% a year against 10.7% for the index, with a smaller worst fall. Run with the popular rule “never sell a call below your cost basis”, it made 10.1%, but only because it spent most of the time just holding the shares, once for more than five years in a row.
What is the wheel strategy?
The wheel is two option trades run one after the other, on a stock or ETF you wouldn’t mind owning:
- Sell a cash-secured put: you keep enough cash to buy the shares at the strike price, and you collect a premium.
- If the put expires worthless, sell another one. If the price is below the strike at expiry, you are assigned and you now own the shares.
- With the shares, sell covered calls each month until a call is exercised and the shares are called away. You are back in cash, and the wheel starts again with a put.
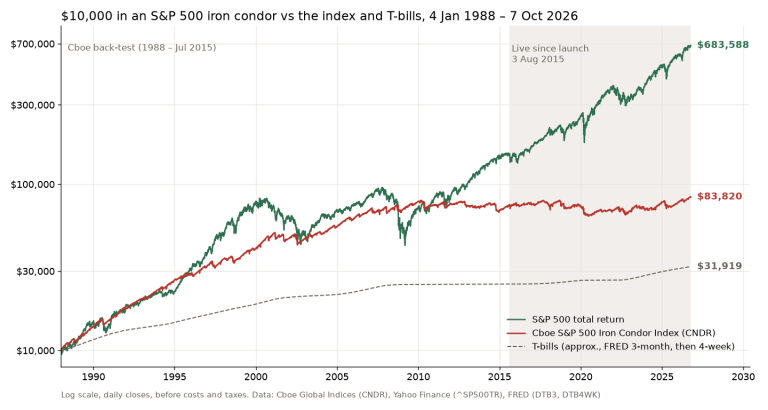
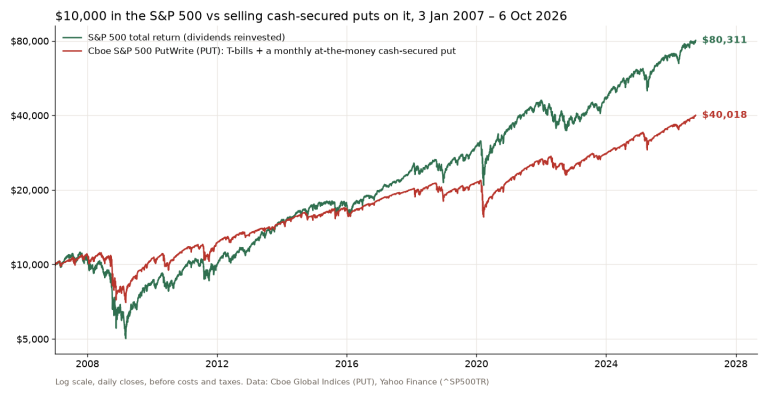
Every step pays a premium, which is why the wheel gets sold as monthly income. I tested both halves separately before. My cash-secured put post covers the first half, and the covered call post the second. This post is about what happens when you join them, and about the one rule most wheel traders add.
The rule that changes everything: never sell below cost
Your cost basis on the wheel is the strike you were assigned at, minus the put premium you collected. Most wheel guides say to sell your calls at or above that number, so that if the shares are called away you never lock in a loss.
Here is what that rule did on the S&P 500 in my model. On 21 September 2007 the index closed at 1,525.75. A one-month at-the-money put at that strike was worth about 25 points, 1.7% of the strike. On 19 October the index closed at 1,500.63, below the strike, so the put was assigned. The cost basis was 1,500.44.
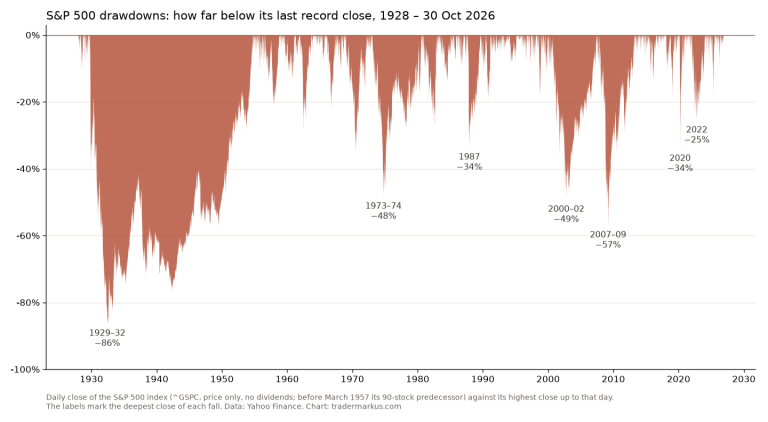
From then on, the rule allowed only calls with a strike of at least 1,500.44. The index fell to 676.53 on 9 March 2009. At that level a call struck at 1,500 brings in close to nothing, so the wheel was simply holding the index. It was finally called away at the February 2013 expiry, on 15 February, with the index at 1,519.79. That is nearly five years and four months of “income strategy” that was really buy-and-hold with a few cents of premium.
It happened again, shorter: assigned on 17 December 2021 and called away on 15 December 2023, almost two years later.
How I tested it
There is no Cboe wheel index, so I built the wheel myself. On the third Friday of every month (the day before when that Friday is a holiday, as in Cboe’s own rules), the model sells a one-month S&P 500 option at the closing price. In the put phase the strike is at the money and the cash sits in 3-month Treasury bills. In the share phase it holds the index with dividends and sells a call, either at the money or at the cost basis if that is higher. That is 232 monthly rolls, from 20 July 2007 to 30 October 2026.
The options are priced with the Black-Scholes formula, using the VIX for volatility. That was too generous at first: with the VIX as it is, the model’s put-selling half made 11.5% a year, against 7.1% for Cboe’s real PutWrite index on the same days. The VIX is built from out-of-the-money options as well, so it runs above the volatility of an at-the-money option. I scaled it to 0.82 times the VIX, which puts the model’s put selling at 6.2% a year, between the real PutWrite (7.1%) and the real BuyWrite covered-call index (5.9%). A second, separately written program re-ran every roll and matched the model’s results on all 231 completed months.
It is still a model. The calls in the cost-basis version are often far out of the money, and real out-of-the-money calls usually trade below that volatility, so if anything the model pays the cost-basis wheel more premium than the market would have.
What the wheel made
| 2007–2026 | $10k became | Worst fall |
|---|---|---|
| S&P 500 | $71,237 10.7% a year |
−55.3% |
| Wheel, cost rule |
$64,236 10.1% a year |
−48.7% |
| Wheel, at the money |
$31,082 6.1% a year |
−37.3% |
| Cboe PUT (real) |
$37,443 7.1% a year |
−37.1% |
| Cboe BXM (real) |
$30,124 5.9% a year |
−40.1% |
From 20 July 2007 to 30 October 2026. S&P 500 with dividends. The two wheels are my model; PUT and BXM are Cboe’s published indexes. Before costs and taxes.
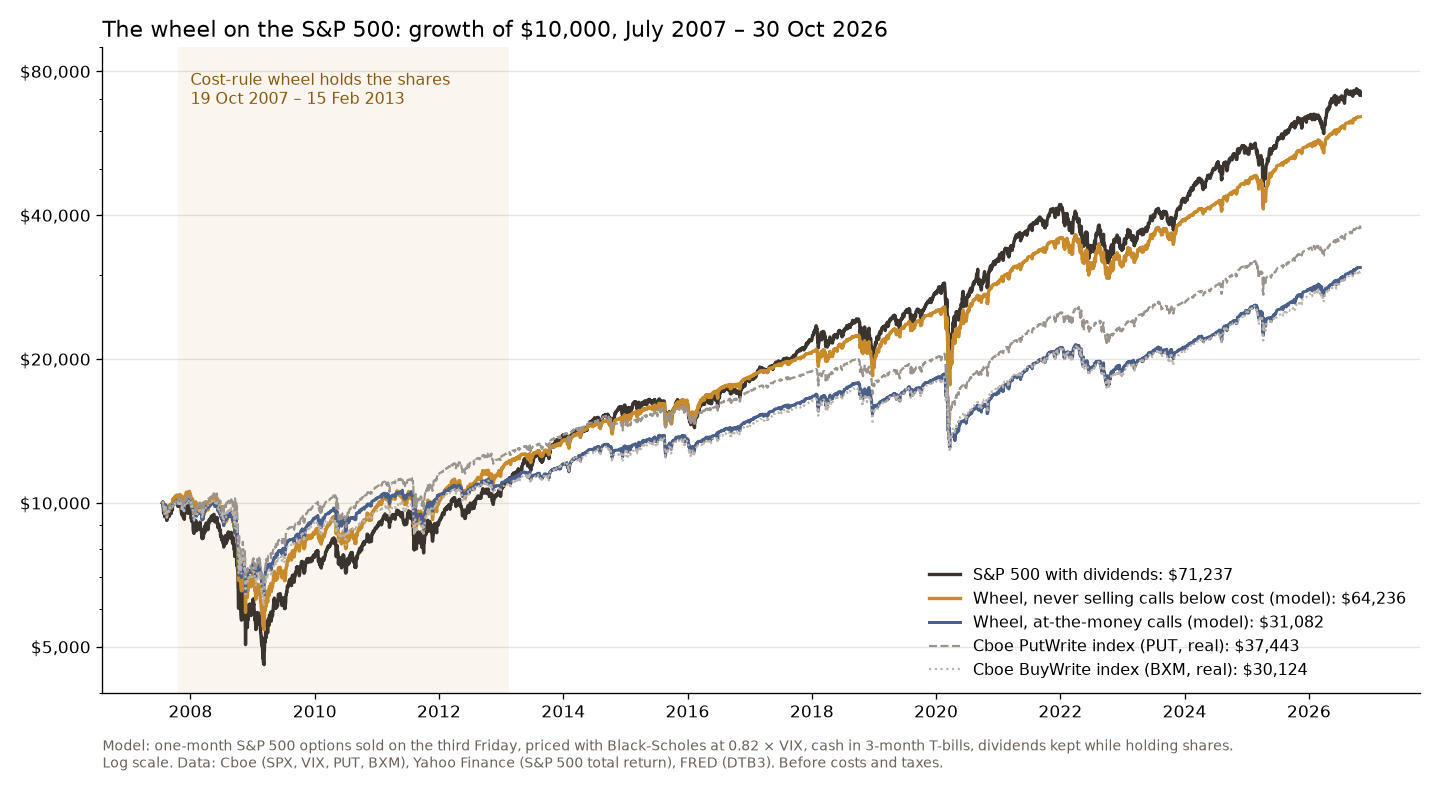
The mechanical wheel, selling at the money in both phases, ended almost exactly where Cboe’s covered-call index did. That isn’t a coincidence. At the same strike, a cash-secured put and a covered call have nearly the same payoff, so the wheel is the same trade wearing two different coats. It was assigned 56 times and spent a third of the time in shares, and the switching didn’t add anything.
The cost-rule wheel did much better, 10.1% a year, but look at why. It was assigned 32 times and spent 63% of the time holding the shares, mostly with calls so far above the price that they rarely paid much. It made more because it was mostly the index, and its worst fall, −48.7%, was close to the index’s −55.3%.
Capped gains, most of the losses
The real Cboe indexes show the shape of the trade month by month. Since the PutWrite index launched in June 2007, the S&P 500 with dividends rose more than 4% in 49 months. In those months both the put-selling and the covered-call index made +3.56% on average, against +6.52% for the index. In the 32 months the index fell more than 4%, the put index lost 4.78% and the covered-call index 5.15%, against 7.06% for the index.
So in a big up month you keep a little over half, and in a big down month you take two thirds or more. The premium softens the losses but caps the gains, and over a long rising market the caps cost more. In 2020 the mechanical wheel lost 6.1% while the S&P 500 made 18.4%. Its put, struck at 3,337.75, was assigned at the 20 March expiry with the index at 2,304.92. The next call was struck at that low price, so the shares were called away at 2,304.92 on 17 April, when the index was already back at 2,874.56.
Is the wheel strategy profitable?
In my model, yes: both versions made money over 19 years. Neither made more than holding the S&P 500. The mechanical version gave a calmer ride for about 4.7 percentage points a year less return. The cost-basis version gave almost the index’s return and almost its crash, and spent long stretches as plain buy-and-hold, which you could have had without the options.
Back in 2022, reviewing an options book, I wrote that “selling options without a hedge or a credit spread alike strategy is very risky”, and the wheel is unhedged selling in both phases. That same year I wrote that I don’t aim for the highest return, but to manage risks and compound risk premium over time. If calmer is what you want, the mechanical wheel delivers it, but so does holding less of the index and more cash, with fewer moving parts. If the wheel is meant to beat the market, 19 years of S&P 500 data don’t support that. A single stock with richer premiums can look better for a while, but it adds the risk that the stock never comes back to your cost basis at all.
Not financial advice. This is educational content, shared for information and entertainment only, and it is not a recommendation to buy or sell any asset. Backtests and past results do not guarantee future results, and the numbers or charts here may contain mistakes. Trading carries risk, including losing all the money you put in. Do your own research before you make any decision.
FAQ
How risky is the wheel strategy?
About as risky as owning the stock, with the upside capped. In my S&P 500 model the worst fall was −37.3% for the mechanical wheel and −48.7% with the cost-basis rule, against −55.3% for the index.
Can you make money with the wheel strategy?
Yes, 6% to 10% a year on the S&P 500 in my model from 2007 to 2026, before costs and taxes. Holding the index made 10.7%.
Which ETF is best for the wheel strategy?
The wheel needs an ETF with liquid monthly options and one you would be happy to hold for years, because the cost-basis rule can leave you holding it that long. My model uses the S&P 500, so it tells you what the wheel did on the broad market, not which ticker to pick.
Does Warren Buffett use the wheel strategy?
Buffett has sold put options, which I wrote about in my cash-secured put post. I haven’t found a source that says he runs the wheel.