Max drawdown is the biggest fall from a peak to a later low, in percent. For the S&P 500 it is −86.2%, from September 1929 to June 1932, and the index needed until September 1954 to close above the 1929 high again. Since 1950 the worst was −56.8% in 2007–09. And the normal state of the market is to be in a drawdown: since 1950 the S&P 500 closed below an earlier record on 93% of trading days.
What is max drawdown?
A drawdown is how far an account, a fund or an index is below its last high. The maximum drawdown is the deepest of those falls over a period: the largest drop from a peak to a low that came after it. A later recovery doesn’t change it. If a fund fell 40%, came back and made new highs, its max drawdown is still −40%.
It answers a different question than the return. The return tells you where you ended. The max drawdown tells you the worst thing that happened on the way, which is usually the moment people sell.
How to calculate max drawdown
Max drawdown = (lowest value after the peak − peak value) ÷ peak value. Take the S&P 500 in 2020. It closed at a record 3,386.15 on 19 February and at 2,237.40 on 23 March. (2,237.40 − 3,386.15) ÷ 3,386.15 = −33.9%.
For a whole price history you need a running peak, because the low has to come after the high it’s measured from. In Excel or Google Sheets, with closing prices in column B from row 2:
- C2: =MAX($B$2:B2), copied down, gives the highest close so far.
- D2: =B2/C2-1, copied down, gives the drawdown on each day.
- =MIN(D:D) gives the max drawdown.
The way back is always longer than the way down. After a 10% fall you need +11.1% to get back to the high, after 20% you need +25%, after 50% you need +100%, and after the 86.2% fall of 1929–32 you needed +624%.
The S&P 500’s biggest drawdowns
I took the S&P 500’s daily closes from Yahoo Finance, from the end of 1927 to 30 October 2026. Before March 1957 the index had 90 stocks; S&P expanded it to 500 on 4 March 1957. These are price-only numbers, without dividends, and every peak and low since 1975 matches Cboe’s own closing prices.
The 1929 crash is in a class of its own: −86.2% from 31.86 on 16 September 1929 to 4.40 on 1 June 1932, and 25 years before the index closed above 31.86 again. Since 1950 there have been 11 falls of 20% or more from a record close:
| Peak | Fall | Back at the high |
|---|---|---|
| Aug 1956 | −21.5% | Sep 1958 |
| Dec 1961 | −28.0% | Sep 1963 |
| Feb 1966 | −22.2% | May 1967 |
| Nov 1968 | −36.1% | Mar 1972 |
| Jan 1973 | −48.2% | Jul 1980 |
| Nov 1980 | −27.1% | Nov 1982 |
| Aug 1987 | −33.5% | Jul 1989 |
| Mar 2000 | −49.1% | May 2007 |
| Oct 2007 | −56.8% | Mar 2013 |
| Feb 2020 | −33.9% | Aug 2020 |
| Jan 2022 | −25.4% | Jan 2024 |
The S&P 500’s close on its record day before the fall, the deepest close in percent, and the month it first closed at or above that record again.
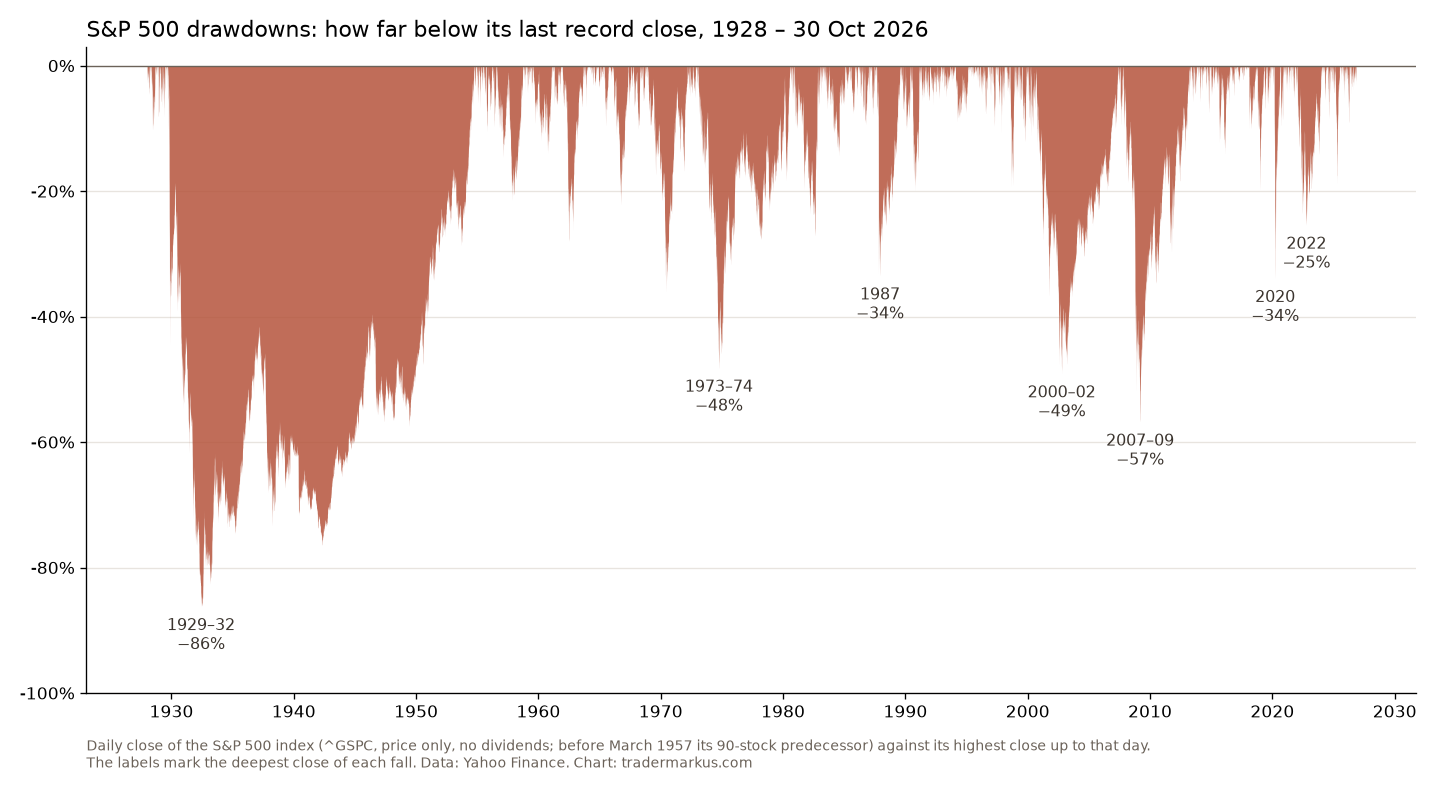
The depth and the time to recover don’t go together. The 2020 fall was as deep as 1987’s and was over in six months. The 1973–74 fall was shallower than 2007–09 but kept the index under its old high for seven and a half years, through the high inflation of the late 1970s. The 2000–02 one took seven years for −49%.
Dividends shorten the wait
Price-only numbers make the waits look longer than they were for someone who reinvested dividends. With dividends included (the total return index, which Yahoo has from 1988), the 2007–09 fall was −55.3% and the index was back at its high in April 2012, almost a year earlier than the price index. The 2000–02 fall was −47.4% with dividends, back in October 2006 instead of May 2007. The max drawdown of the total return index since 1988 is −55.3%, and over the same years it made 11.4% a year.
Max drawdown of the Nasdaq, gold and Bitcoin
| Market | Worst fall | Back after |
|---|---|---|
| Nasdaq-100 (1985) |
−82.9% 2000–02 |
15.6 years |
| Gold futures (2000) |
−44.4% 2011–15 |
8.9 years |
| Bitcoin (2014) |
−83.4% 2017–18 |
3.0 years |
The year in brackets is where the data starts. “Back after” is the time from the record close before the fall to the first close back at or above it. Gold uses Yahoo’s continuous futures prices, so the 1980–2001 bear market is not in the data.
The Nasdaq-100 fell 82.9% from March 2000 to October 2002 and didn’t close above its 2000 high until November 2015. Bitcoin has had two falls of more than 75% in this data, in 2017–18 and 2021–22, and it is in a deep one now: it closed at a record $124,753 on 6 October 2025, fell to $58,559 on 30 June 2026 (−53.1%) and closed 30 October 38.1% below the record. Gold closed at a record $5,318.40 on 29 January 2026 and was 26.7% below it on 30 October.
What is a good max drawdown?
There is no number that is good in general. A drawdown is only bad when it’s bigger than you expected, because that is when you abandon the plan. I wrote in 2021 that “half the expected drawdown will already make traders uncomfortable”: if a backtest shows 20%, expect trouble at 10%. The fix I wrote about then is to put less capital into a strategy whose drawdown you couldn’t sit through, rather than to look for one that never falls. My full thoughts on that are in Every trading strategy has drawdowns.
The same post says buy-and-hold investors in the US market have to face 50% drawdowns for a 10% average annual return. The data agree: 11.4% a year with dividends since 1988, and a −55.3% fall along the way. In the backtests I’ve run here, a smaller drawdown has usually come with a lower return, which you can also get by simply holding less. Two examples are the 200-day moving average rule and the trailing stop loss test.
Two more things. Your worst drawdown is probably still ahead, because the max drawdown can only get deeper as the history gets longer. And a backtest’s max drawdown is one path; the risk of ruin post shows how much worse the luck of the order can make it.
Being in a drawdown is normal
From 1950 to 30 October 2026 the S&P 500 closed at a new record on 7% of trading days. On the other 93% it was below an earlier high. It was more than 10% below the last record on 41% of days and more than 20% below it on 21% of days.
I wrote the same about my own account: “one’s trading account is in a drawdown most of the time”. The index makes that look smooth on a long chart, but day to day it is mostly underwater. In January 2023 I called drawdowns scars showing that we have survived, and that is still how I see them. On 30 October 2026 the S&P 500 was 3.1% below its 6 October record, a drawdown so small nobody notices it. The Nasdaq-100 wasn’t that calm: on 2 November it closed 10.4% below its own 6 October record, its third fall of more than 10% in about a year.
Not financial advice. This is educational content, shared for information and entertainment only, and it is not a recommendation to buy or sell any asset. Backtests and past results do not guarantee future results, and the numbers or charts here may contain mistakes. Trading carries risk, including losing all the money you put in. Do your own research before you make any decision.
FAQ
What does max drawdown mean in simple terms?
The worst loss you would have had if you bought at the top and sold at the bottom. For the S&P 500 since 1950 it is −56.8%, from October 2007 to March 2009.
How do you calculate max drawdown in Excel?
Put the prices in column B. In column C keep the running high with =MAX($B$2:B2), in column D the drawdown with =B2/C2-1, and take =MIN(D:D). The result is the max drawdown as a negative percentage.
What was the S&P 500’s worst drawdown?
−86.2%, from 16 September 1929 to 1 June 1932, on price. It took until 22 September 1954 to close above the 1929 high again.
How long does it take to recover from a drawdown?
For the S&P 500’s 11 falls of 20% or more since 1950, from six months (2020) to seven and a half years (1973–74) on price alone. Dividends shorten it: the 2007–09 fall took 4.5 years with dividends and 5.5 years without.