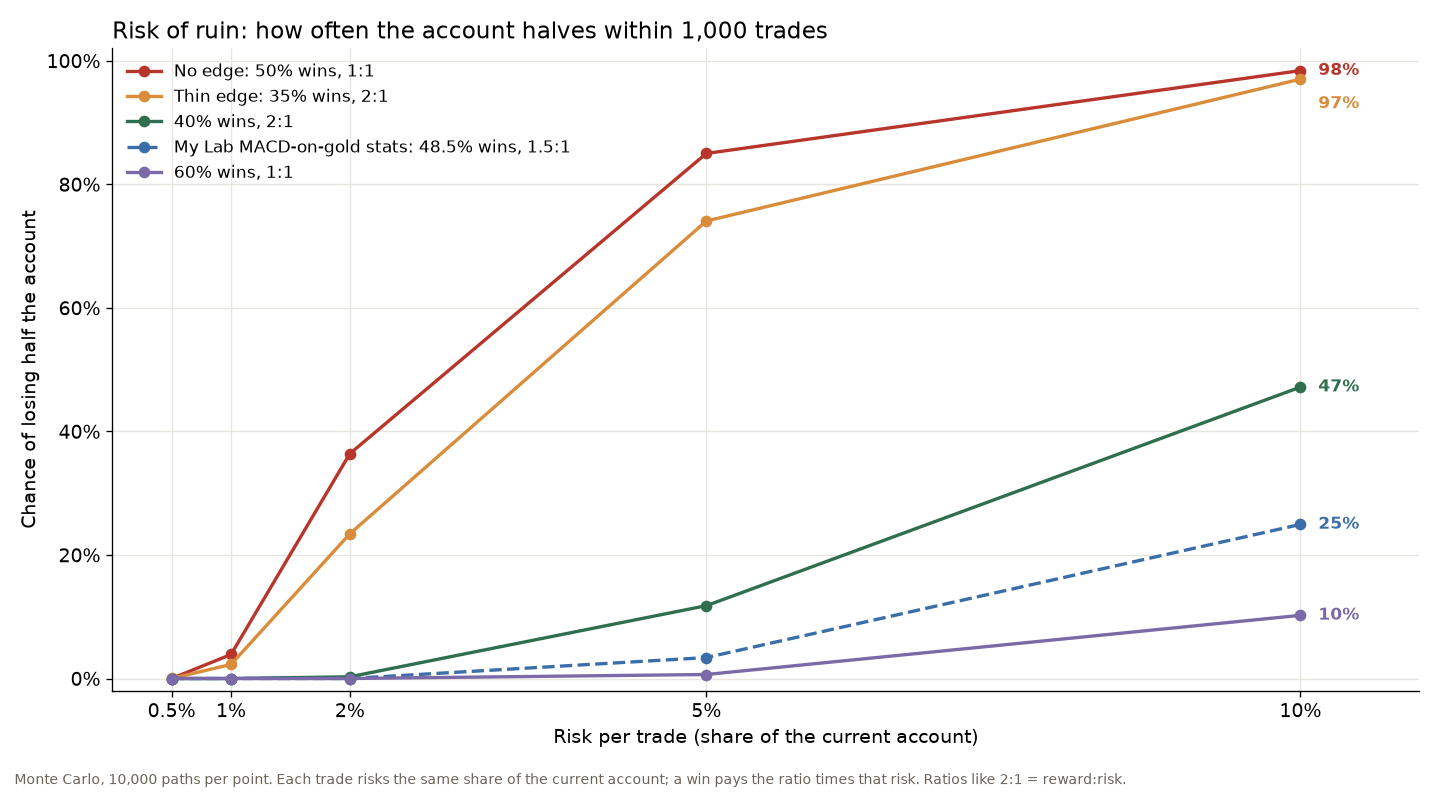
Risk of ruin is the chance that a run of losses takes your account down to a point you can’t come back from. I simulated 1,000 trades, 10,000 times over, for five different traders. With a solid edge, risking 1–2% per trade almost never cut the account in half. At 10% per trade, even a solid edge halved the account up to 47% of the time. And with no edge at all, 2% per trade still halved it in 36% of the runs. The size of each bet decides your risk of ruin far more than the strategy does.
What is risk of ruin?
The classic definition, as Wikipedia puts it, is the likelihood of losing all your capital or falling below the minimum you need to keep playing. It comes from gambling and insurance, and it applies to trading without changes: if your account gets small enough, you are out of the game, whatever your system would have done next.
I define ruin a little earlier than zero: losing half the account. If you risk a fixed percentage of what you have, you never quite reach zero, because each loss gets smaller. But a 50% loss needs a 100% gain to get back to where you started, and in my experience most traders give up on the method long before that. For practical purposes, half is ruin.
How I calculated it
Each simulated trader risks the same share of the current account on every trade, say 2%. A loss costs that 2%. A win pays the reward:risk ratio times that amount, so a 2:1 trade at 2% risk makes 4%. Wins and losses come at random with a fixed win rate. I ran 1,000 trades per path and 10,000 paths for each combination, then counted how many paths fell to half the starting value at any point.
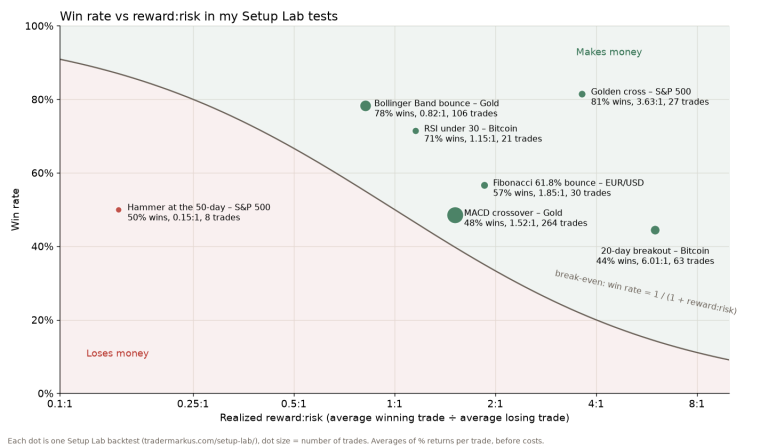
I used five traders. One has no edge at all: 50% wins at 1:1. One has a thin edge: 35% wins at 2:1. Two have a solid edge: 40% wins at 2:1, and 60% wins at 1:1. The fifth uses the real statistics from my MACD crossover test on gold in the Setup Lab: 48.5% winners, average win 1.52 times the average loss, over 264 trades.
Risk of ruin table
The chance of losing half the account within 1,000 trades, by risk per trade. The coin flip is the trader with no edge: 50% winners at 1:1.
| Trader | 1% | 2% | 5% | 10% |
|---|---|---|---|---|
| Coin flip (no edge) |
4% | 36% | 85% | 98% |
| 35% at 2:1 |
2% | 23% | 74% | 97% |
| 40% at 2:1 |
0% | 0.3% | 12% | 47% |
| MACD on gold |
0% | 0% | 3% | 25% |
| 60% at 1:1 |
0% | 0% | 0.7% | 10% |
At 0.5% per trade, just one run out of the 50,000 lost half the account (the thin-edge trader). The table says three things. With a solid edge, small size makes ruin practically impossible. With big size, even a real edge can’t save you: the 40%-at-2:1 trader has the same edge per trade as the 60%-at-1:1 trader, yet at 10% risk it halves the account almost five times as often, because its losing streaks are longer. And with no edge, size only decides how fast the end comes.
Losing streaks: the part that actually ruins people
Nobody blows up an account on average results. They blow it up in the streak. So I also measured the longest run of losses in each 1,000-trade path:
| Win rate |
Typical worst streak |
Bad luck (1 in 10) |
|---|---|---|
| 35% | 14 losses | 18 losses |
| 40% | 12 losses | 16 losses |
| 50% | 9 losses | 12 losses |
| 60% | 7 losses | 9 losses |
A 40% win-rate trader should expect a streak of about 12 losses somewhere in 1,000 trades, and one in ten will see 16. At 2% risk, 16 losses in a row take the account down about 28%. At 5% risk they take it down 56%, which is exactly the ruin line. Real data agrees with the simulation. My MACD test on gold had 264 trades, and its longest losing streak was 7, from March to August 2025. Simulating 264 trades at its 48.5% win rate gives a typical worst streak of exactly 7. The 20-day breakout test on Bitcoin had 6 in a row between February 2018 and March 2019.
Is risking 2% per trade too much?
With a tested edge, no. In my simulation the three traders with a solid edge had at most a 0.3% chance of losing half the account at 2% risk. Without an edge, 2% is a lot: more than a third of those runs halved the account. The trouble is that you don’t know which one you are until you have a few hundred trades behind you. That is why I keep any single loss under about 1% of the account, as I wrote in one of my performance updates, and let the stop loss on the chart set the position size, not the other way round. A $50,000 account risking 1% is $500 per trade; with a $2.50 stop, that’s 200 shares.
How to lower your risk of ruin
- Size from the stop. Decide the risk in dollars first, then divide by the distance to the stop. Never start from the number of shares you want.
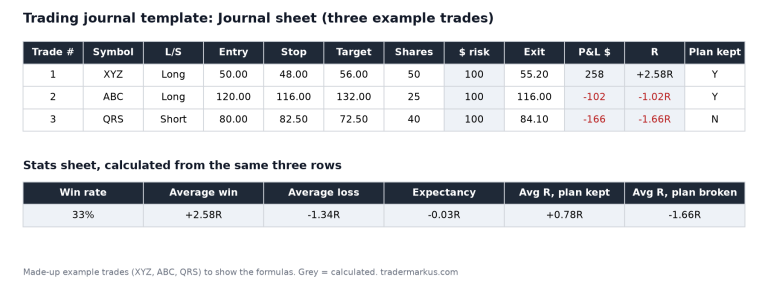
- Keep risk per trade small until you have enough trades to know your real win rate and payoff. A trading journal gives you those numbers.
- Plan for the streak. Take the bad-luck streak from the table for your win rate and multiply it by your risk per trade. If that number scares you, your size is too big.
- Don’t raise size after losses to win it back. That turns a normal streak into ruin, and it’s the same trap as FOMO in the other direction.
FAQ
How do you calculate risk of ruin?
There are closed-form formulas for simple cases, but the easiest honest way is a simulation like this one. Take your win rate, your average win divided by your average loss, and your risk per trade, then simulate many sequences of trades and count how often the account falls below your ruin level.
What is a good risk of ruin?
As close to zero as you can get. Over 1,000 trades, I’d want less than a 1% chance of losing half the account. In my table that means 1–2% risk per trade with a tested edge.
Can you have zero risk of ruin?
Not if you trade. Even at small size, a big enough gap or a broken system can do damage the simulation doesn’t see. Real markets also have gaps through stops, which make some losses bigger than planned.
Your edge decides whether you make money. Your size decides whether you are still around to collect it.
Not financial advice. This is educational content, shared for information and entertainment only, and it is not a recommendation to buy or sell any asset. Backtests and past results do not guarantee future results, and the numbers or charts here may contain mistakes. Trading carries risk, including losing all the money you put in. Do your own research before you make any decision.