Bollinger Bands are a 20-day moving average with a band two standard deviations above and below it. I tested John Bollinger’s own rules on the S&P 500 since 1970, gold since 2000 and Bitcoin since 2014. About 88% of closes stayed inside the bands, not the 95% the textbooks promise. A close below the lower band was followed by better-than-usual returns on the S&P 500. On Bitcoin it was the other way round: the best returns came after a close above the upper band. Same indicator, opposite behaviour.
What are Bollinger Bands?
Three lines on a price chart. The middle line is the 20-day simple moving average of the close. The upper band is that average plus two standard deviations of the same 20 closes, and the lower band is the average minus two. When the market gets jumpy, the standard deviation grows and the bands move apart. When it goes quiet, they squeeze together. That’s all the indicator does: it measures how far the price is from its recent average, scaled by how volatile it has been.
John Bollinger publishes his own list of rules on bollingerbands.com. I used his defaults: 20 days, two standard deviations, and the population standard deviation, which he says is the one he uses. The data is daily closes from Yahoo Finance up to 16 October 2026: the S&P 500 index, gold futures and BTC-USD.
How often does the price close outside the bands?
If prices were normally distributed, two standard deviations would hold about 95% of them. They aren’t, and Bollinger says so himself: “In practice we typically find 90%, not 95%, of the data inside Bollinger Bands with the default parameters.” My numbers agree with him:
| Market | Inside | Below | Above |
|---|---|---|---|
| S&P 500 | 89.2% | 5.1% | 5.7% |
| Gold | 87.6% | 4.4% | 8.0% |
| Bitcoin | 87.1% | 4.5% | 8.3% |
So a close outside the bands happens on about one day in eight. That is not rare enough to call every one of them an extreme. Gold and Bitcoin closed above the upper band almost twice as often as below the lower one, which is what a market in a long uptrend looks like on this indicator.
Is a close below the lower band a buy signal?
It’s the most popular way to trade the bands: the price closed under the lower band, it has gone too far, buy it. Bollinger’s rule 6 says the opposite: “A tag of the lower Bollinger Band is NOT in-and-of-itself a buy signal.” And his rule 8 says closes outside the bands are “initially continuation signals, not reversal signals”.
To test it I took the first close outside a band (not the second or third day in a row) and measured the return over the next 20 trading days (20 days for Bitcoin, which trades every day), against the return after any day.
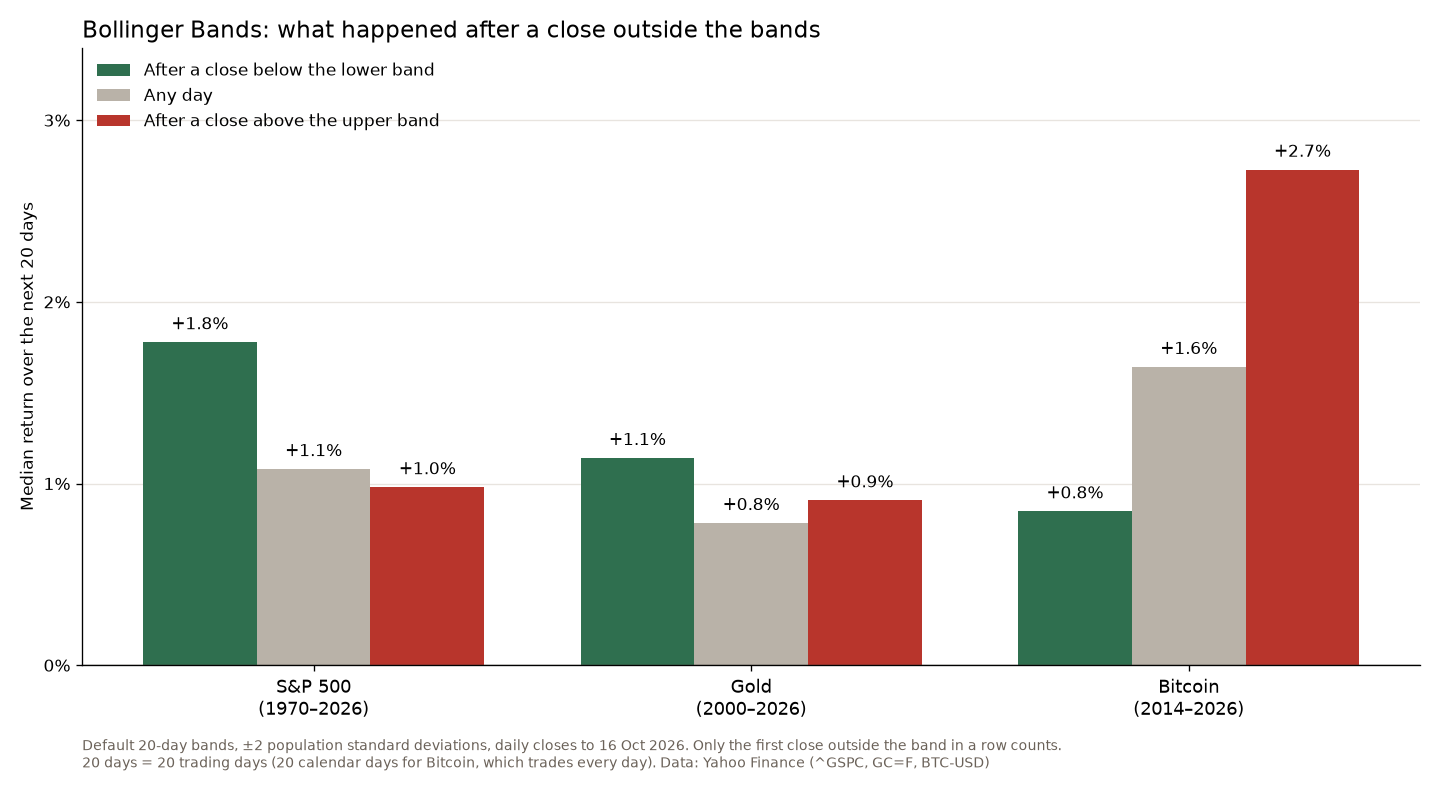
On the S&P 500 the popular version wins. After 402 closes below the lower band the median 20-day return was +1.8%, against +1.1% after any day, and 66% of them were higher 20 days later, against 61%. Stocks tend to bounce after a sharp drop, and here it shows. For an index it is mean reversion, not continuation.
Gold leans the same way, more weakly: +1.1% after the lower band against +0.8% for any day, and 60% higher against 57%.
Bitcoin doesn’t bounce. After 97 closes below the lower band the median was +0.8%, half of the +1.6% after any day, and only 53% were higher. On Bitcoin, a close below the band was more often the start of a fall than the end of one. I found the same in my Setup Lab test of RSI under 30 on Bitcoin: buying weakness in a momentum market doesn’t pay much.
Is a close above the upper band a sell signal?
Not on these three markets. On the S&P 500 the 20 days after a close above the upper band were a little weaker than average (+1.0% against +1.1%), but 62% still ended higher. That isn’t a sell signal. It’s a normal month.
Bitcoin is where Bollinger’s continuation rule really works. After 158 closes above the upper band the median 20-day return was +2.7%, against +1.6% after any day, and 60% were higher. Rule 7 says that in a trend the price “can, and does, walk up the upper Bollinger Band”, and Bitcoin does exactly that. Selling Bitcoin because it closed above the band meant selling strength in a market that rewards it. It’s the same thing I saw in the data for FOMO trading: on Bitcoin, buying after a big week wasn’t the mistake people think it is.
The Bollinger Band squeeze
The squeeze is the bands at their narrowest: low volatility that is supposed to come before a big move. Bollinger measures the width with BandWidth, the distance between the bands divided by the middle line. He doesn’t give a fixed lookback on his rules page, so I used the narrowest BandWidth in six months (126 days) and counted the first day of each squeeze.
The next 20 days were not more exciting than usual. The median move, up or down, after a squeeze was 2.3% on the S&P 500 against 2.6% after any day, 3.3% against 3.0% on gold, and 5.6% against 8.8% on Bitcoin. Quiet markets mostly stayed quiet for another month. The squeeze tells you volatility is low, and that it will rise one day. It doesn’t tell you when, or in which direction: Bitcoin was higher 20 days after only 20 of its 59 squeezes.
For what it’s worth, the bands are narrow on two of the three right now. On 16 October the S&P 500’s BandWidth was 2.8%, narrower than on 92% of the days since 1970, and Bitcoin’s was 6.9%, narrower than on 93% of the days since 2014. Neither is at its six-month low yet, so by my definition it isn’t a squeeze.
How I use Bollinger Bands
The test says the same thing the man who invented the bands says: a touch of a band is information, not a signal. What that information means depends on the market. On a stock index a close under the lower band has been a reasonable place to look for a long trade. On Bitcoin it has been a warning, and a close above the upper band has been a sign of strength, not of excess.
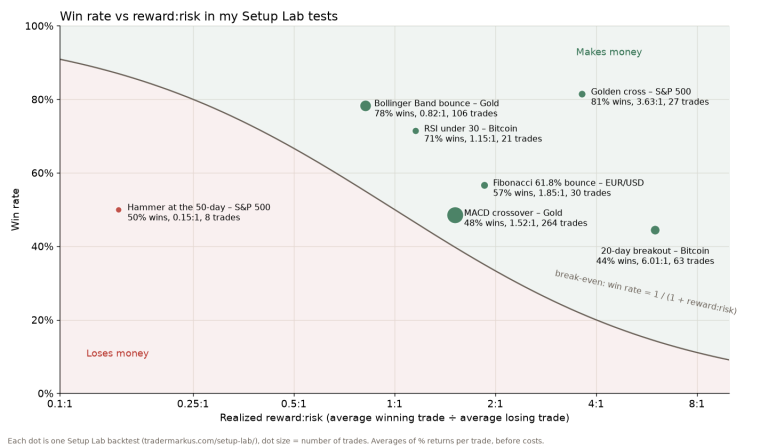
So I use the bands as a volatility gauge. They tell me how stretched the price is compared with its own recent past, and how wide my stop needs to be so normal noise doesn’t hit it, which is the same idea as in my stop loss post. I don’t trade a band touch on its own. My Setup Lab tested the classic lower-band bounce on gold with strict rules: buying gold at the lower Bollinger Band won 78% of 106 trades but made 4.2% a year, against 11.0% for just holding gold. Right often, paid little.
FAQ
What is the middle line in Bollinger Bands?
The 20-day simple moving average of the closing price. The upper and lower bands are drawn two standard deviations above and below it.
What are the best Bollinger Band settings?
Bollinger calls 20 periods and two standard deviations defaults and nothing more. He suggests 2.1 standard deviations for a 50-period average and fewer for a shorter one, to keep the same share of prices inside the bands. I used the defaults here, because that’s what most charts show.
Do Bollinger Bands work on crypto?
They work as a measure of volatility. As a signal they behave differently from stocks: on Bitcoin, closes above the upper band were followed by better returns than average, and closes below the lower band by worse ones.
Same three lines, three markets, two opposite answers. Know which market you are in before you trust the band.
Not financial advice. This is educational content, shared for information and entertainment only, and it is not a recommendation to buy or sell any asset. Backtests and past results do not guarantee future results, and the numbers or charts here may contain mistakes. Trading carries risk, including losing all the money you put in. Do your own research before you make any decision.